
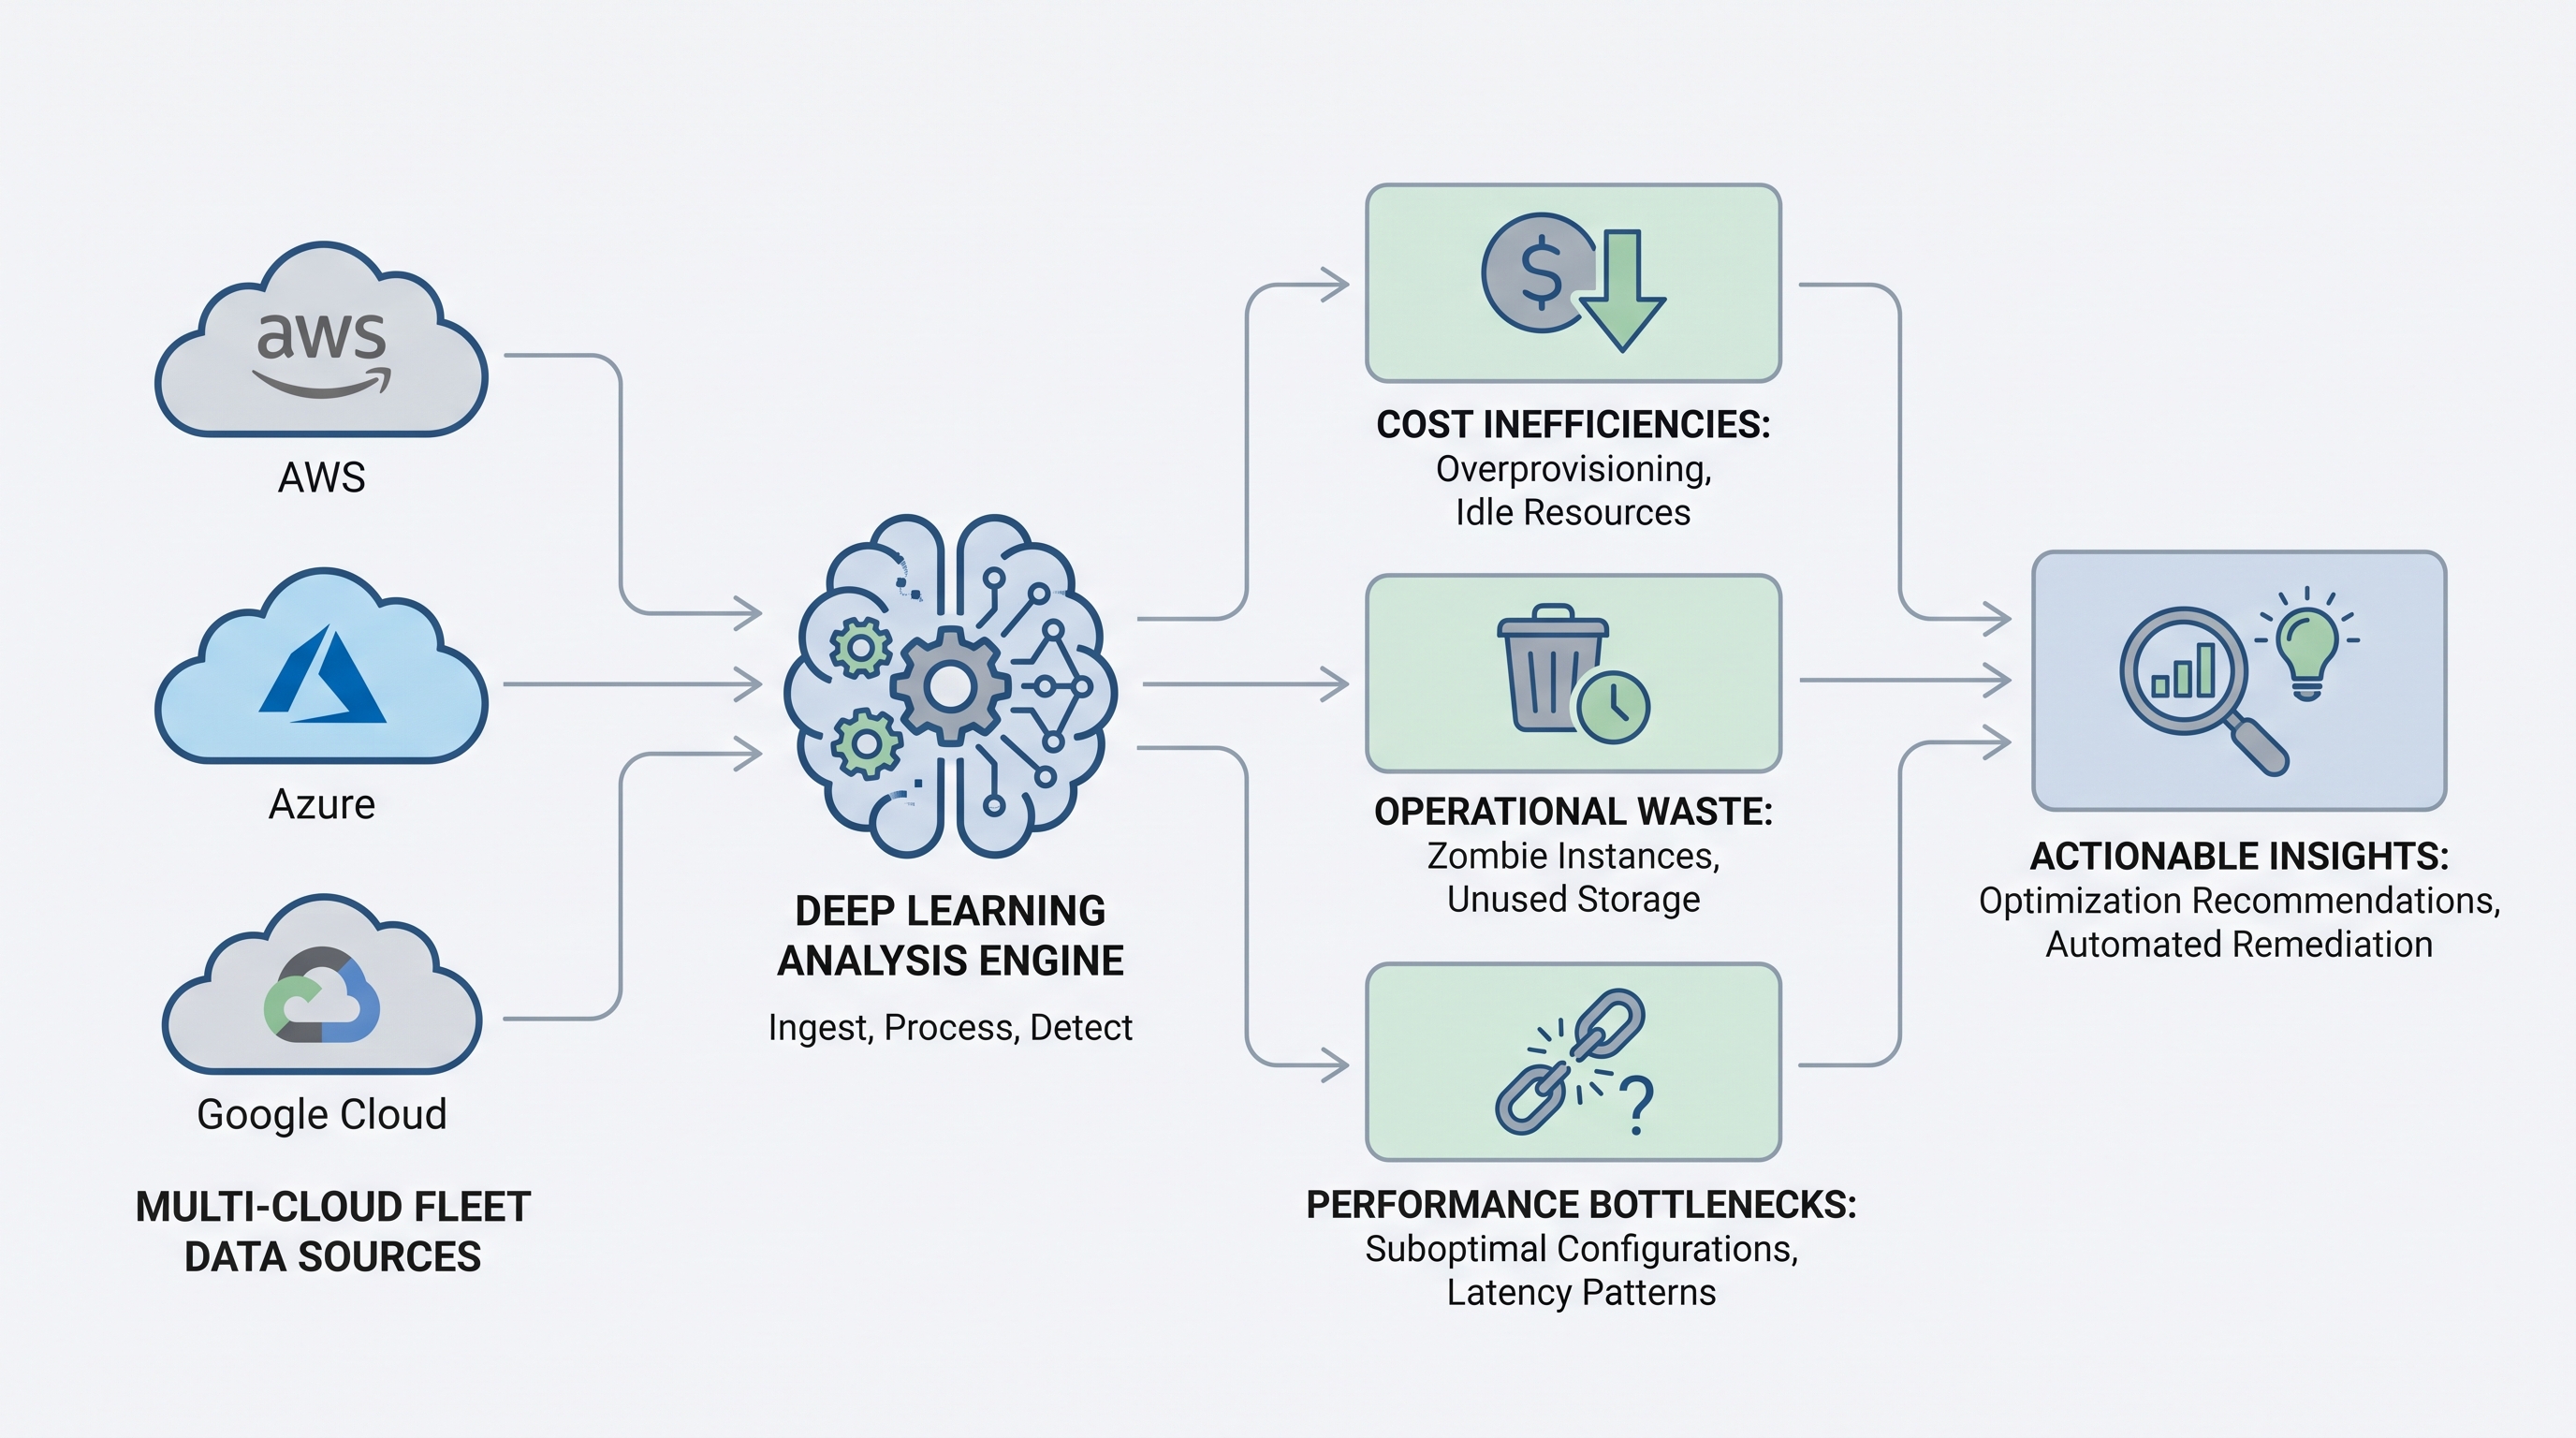
The Multi-Cloud Waste Crisis: Beyond Simple Thresholds
In modern enterprise IT, multi-cloud strategies are no longer a luxury—they are the standard. Organizations routinely distribute workloads across Amazon Web Services (AWS), Microsoft Azure, Google Cloud Platform (GCP), and Oracle Cloud Infrastructure (OCI) to maximize resiliency and avoid vendor lock-in. However, this architectural diversity introduces unprecedented operational complexity. The primary casualty of this complexity is financial efficiency. Traditional, static rules-based approaches to cloud cost optimization are failing under the weight of dynamic, ephemeral, and highly distributed infrastructure.
Historically, FinOps teams relied on simple heuristics to detect waste. A common rule might state: "If a virtual machine's CPU utilization remains below 5% for more than 14 days, flag it for termination." While this approach was sufficient in the era of monolithic, long-running on-premises servers, it is fundamentally incompatible with modern cloud-native architectures. Today, workloads are highly elastic, characterized by auto-scaling groups, containerized microservices, serverless functions, and transient batch jobs. A machine running at 2% CPU utilization might be a critical hot-standby database replica, a message broker waiting for a spike, or a specialized node configured for high memory bandwidth rather than compute power.
Applying simplistic thresholds to these workloads leads to two equally destructive outcomes: high false-positive rates that disrupt production operations, or high false-negative rates that allow millions of dollars in cloud spend to vanish into idle resources. To solve this, enterprises must transition to intelligent, context-aware anomaly detection. By leveraging deep learning models, cloud architects can analyze high-dimensional telemetry data to discover complex, non-linear patterns of inefficiency across their entire multi-cloud fleet.
Why Static Thresholds Fail in Modern Multi-Cloud Environments
To understand why deep learning is necessary, we must first analyze the math and mechanics behind why static thresholds fail. Consider a standard compute instance. Its utility is not defined by a single metric but by a multi-dimensional vector of time-series data including CPU utilization, memory allocation, network input/output, disk read/write IOPS, and application-specific metrics.
Static systems treat these metrics in isolation. For example, they look at CPU usage without correlating it to memory footprint or network throughput. This isolated analysis misses structural waste patterns such as:
The "Zombie" Instance: An instance that is actively sending heartbeat signals (generating low-level CPU and network traffic) but performing no actual business logic.
The Over-Provisioned Node: A database host with high memory allocation but near-zero disk IOPS, indicating that the instance type was chosen incorrectly for its workload profile.
Uncoordinated Auto-Scaling: Auto-scaling groups that scale up rapidly during peak hours but fail to scale down due to misconfigured cool-down periods or lingering TCP connections.
Furthermore, cloud metrics are highly seasonal. A retail workload will exhibit daily peaks, weekly cycles, and massive seasonal spikes during holidays. A static threshold cannot differentiate between a normal weekend drop in utility for an internal development environment and a genuine abandonment of that environment. To truly isolate waste, we must model the expected temporal behavior of resources and identify deviations from those learned profiles. This requires a transition to deep learning models that excel at pattern recognition in sequential, multi-dimensional datasets.
The Deep Learning Paradigm: Autoencoders and LSTMs for Cloud Metrics
Deep learning offers powerful architectures designed specifically for time-series anomaly detection and pattern recognition. Two of the most effective architectures for identifying multi-cloud waste are Autoencoders (AEs) and Long Short-Term Memory (LSTM) networks.
1. Autoencoders for Unsupervised Anomaly Detection
An Autoencoder is a type of artificial neural network used to learn efficient data codings in an unsupervised manner. The network consists of two main parts: an encoder, which compresses the input data into a lower-dimensional bottleneck layer (latent space), and a decoder, which attempts to reconstruct the original input from this compressed representation.
When applied to cloud efficiency, we train the Autoencoder solely on telemetry data from highly optimized, well-utilized resources. The network learns the underlying correlation patterns between CPU, memory, disk, and network metrics for healthy, efficient workloads. When we pass metrics from the entire fleet through the trained model, we calculate the Reconstruction Error (typically using Mean Squared Error, or MSE):
L(x, x̂) = (1/n) * Σ (x_i - x̂_i)²
Where x represents the input metrics vector and x̂ represents the reconstructed metrics vector. If a resource is highly inefficient or misconfigured, its metric correlation profile will differ substantially from the training data. Consequently, the Autoencoder will fail to reconstruct the input accurately, yielding a high reconstruction error. This flags the resource as an anomaly—or in our case, a candidate for structural waste analysis.
2. LSTMs for Temporal and Seasonal Forecasting
While Autoencoders excel at spatial correlation (correlating different metrics at a single point in time), LSTMs are uniquely suited for temporal sequences. LSTMs are a class of Recurrent Neural Networks (RNNs) capable of learning long-term dependencies in time-series data, making them highly effective at modeling cloud metric seasonality.
By training an LSTM on historical resource utilization metrics, we can forecast future utilization. If the model predicts that a cluster will require less than 10% of its provisioned capacity over the next 72 hours with a high degree of confidence, FinOps teams can proactively downsize or pause those resources. Integrating these deep learning techniques into a unified strategy requires a centralized control plane. For instance, using a financial command center allows organizations to visualize these deep-learning-derived insights alongside raw cost data, bridging the gap between deep data science and business operations.
Architecting a Multi-Cloud Telemetry Pipeline
Before any deep learning model can be trained or executed, you must build a robust, scalable telemetry pipeline capable of ingesting, normalizing, and storing high-velocity metrics from multiple cloud providers. AWS, Azure, GCP, and OCI all have different APIs, metric granularities, and naming conventions. Your pipeline must abstract these differences to present a uniform data schema to your models.
Below is a conceptual architecture of a multi-cloud telemetry pipeline designed for deep learning inference:
+------------------+     +--------------------+     +------------------+     +------------------+
|    AWS CloudWatch|     | Azure Monitor Logs |     | GCP Ops Suite    |     | OCI Monitoring   |
+--------+---------+     +---------+----------+     +--------+---------+     +--------+---------+
         |                         |                         |                         |
         +-------------------------+------------+------------+-------------------------+
                                                |
                                                v
                                  +-------------+-------------+
                                  |   Message Queue / Ingestion|
                                  |   (Apache Kafka / Pulsar) |
                                  +-------------+-------------+
                                                |
                                                v
                                  +-------------+-------------+
                                  | Stream Processing Engine  |
                                  | (Apache Flink / Spark)    |
                                  |  - Schema Normalization   |
                                  |  - Missing Data Imputation|
                                  +-------------+-------------+
                                                |
                                                v
                                  +-------------+-------------+
                                  |    Feature & Metric Store |
                                  | (TimescaleDB / Redis / S3)|
                                  +-------------+-------------+
                                                |
                                                v
                                  +-------------+-------------+
                                  |   Deep Learning Inference |
                                  |   (PyTorch / TensorFlow)  |
                                  +---------------------------+
Data Normalization and Schema Definition
To feed metrics into a single neural network, you must map provider-specific metrics to a standard schema. For instance, CPU utilization is represented as CPUUtilization (percent) in AWS CloudWatch, but as Percentage CPU in Azure Monitor. The stream processing layer must normalize these into a unified float value between 0.0 and 1.0.
A typical normalized JSON payload for a compute resource metric packet might look like this:
{
  "timestamp": "2023-10-27T14:30:00Z",
  "resource_id": "i-0a1b2c3d4e5f6g7h8",
  "provider": "aws",
  "region": "us-east-1",
  "instance_type": "m5.2xlarge",
  "metrics": {
    "cpu_utilization": 0.124,
    "memory_utilization": 0.452,
    "network_in_bytes_per_sec": 124500.0,
    "network_out_bytes_per_sec": 89200.0,
    "disk_read_iops": 12.0,
    "disk_write_iops": 45.0
  },
  "tags": {
    "environment": "production",
    "application": "payment-gateway",
    "owner": "checkout-team"
  }
}
This normalized payload ensures that the downstream deep learning models remain cloud-agnostic. The model does not care whether the underlying virtual machine is an EC2 instance, an Azure VM, a GCP Compute Engine instance, or an OCI Compute Shape; it only evaluates the multi-dimensional vector of resource utilization over time.
Implementing an Autoencoder for Waste Detection in PyTorch
Let's look at a practical implementation of an Autoencoder using PyTorch. This model is designed to accept a sequence of multi-dimensional metrics and reconstruct them. High reconstruction errors will point directly to anomalous usage patterns that represent potential cloud waste.
import torch
import torch.nn as nn

class CloudResourceAutoencoder(nn.Module):
    def __init__(self, input_dim, latent_dim):
        super(CloudResourceAutoencoder, self).__init__()

        # Encoder network: Compress input metrics into latent space
        self.encoder = nn.Sequential(
            nn.Linear(input_dim, 64),
            nn.ReLU(),
            nn.Linear(64, 32),
            nn.ReLU(),
            nn.Linear(32, latent_dim),
            nn.ReLU()
        )

        # Decoder network: Reconstruct input from latent space
        self.decoder = nn.Sequential(
            nn.Linear(latent_dim, 32),
            nn.ReLU(),
            nn.Linear(32, 64),
            nn.ReLU(),
            nn.Linear(64, input_dim),
            nn.Sigmoid() # Normalize outputs between 0 and 1
        )

    def forward(self, x):
        latent = self.encoder(x)
        reconstruction = self.decoder(latent)
        return reconstruction

# Example usage:
# Input dimension: 6 metrics (CPU, Memory, NetIn, NetOut, DiskRead, DiskWrite)
# Latent dimension: 2 (extreme compression to force pattern learning)
model = CloudResourceAutoencoder(input_dim=6, latent_dim=2)
criterion = nn.MSELoss()
optimizer = torch.optim.Adam(model.parameters(), lr=0.001)
To train this model, we feed it historical metrics from highly utilized production systems. Once trained, we run inference on the entire active fleet. If an instance has a high memory allocation but zero CPU, network, and disk activity, the Autoencoder's latent space will struggle to represent this highly skewed, uncoordinated state. The resulting reconstruction error will spike, flagging the resource for immediate review.
By leveraging CloudAtler's Atler AI engine, enterprises do not have to build, train, and maintain these deep learning pipelines manually. The platform natively ingests multi-cloud telemetry and applies advanced machine learning models out-of-the-box, instantly highlighting anomalous efficiency profiles across your cloud estate.
Detecting Complex Structural Waste Patterns
Once the telemetry pipeline and deep learning models are in place, we can move beyond basic idle instance detection to uncover highly complex, structural waste patterns that cost enterprises millions annually.
1. Underutilized Compute Lifecycles
Many organizations run environments that are only needed during business hours (e.g., development, testing, and staging environments). However, these environments are often left running 24/7. A deep learning model trained on temporal utilization patterns can easily identify these "office-hours" profiles. By analyzing the temporal footprint of these resources, the model can recommend automated schedules to stop and start instances, saving up to 70% of compute costs for those specific workloads. Implementing comprehensive compute lifecycle analysis ensures that every virtual machine is running only when actively adding value.
2. Cross-Resource Correlation Waste
Cloud waste is rarely isolated to a single virtual machine. Often, a parent resource (like an auto-scaling group or a Kubernetes cluster) is misconfigured, leading to cascading inefficiencies across multiple child resources. For example, a cluster might have an overly aggressive scaling policy that spins up new nodes based on momentary CPU spikes, only for those nodes to sit idle for hours afterward.
To detect these systemic issues, we must analyze the entire ecosystem of resources. Using advanced multi-resource detection capabilities, our deep learning models can correlate parent-child resource relationships, identifying when database clusters, storage volumes, and compute nodes are misaligned in scale and wasting capital collectively.
3. Misaligned Provisioned IOPS and Storage
Storage waste is one of the most common and silent cloud cost-drivers. Engineers frequently provision high-performance SSD storage (such as AWS gp3 or io2 volumes) with high Provisioned IOPS (Input/Output Operations Per Second) to handle worst-case scenarios. Over time, the actual workload demands may drop, but the provisioned IOPS charges remain constant.
Deep learning models can analyze the ratio of actual IOPS consumed to provisioned IOPS over extended periods. By recognizing when peak IOPS never approach the provisioned limits, the system can flag these volumes for non-disruptive downgrades to lower, more cost-effective storage tiers.
FinOps Operationalization: From Detection to Automated Remediation
Detecting cloud waste is only half the battle. The true value of FinOps is realized when detection leads to swift, automated remediation without compromising system stability or security. However, SRE (Site Reliability Engineering) and DevOps teams are notoriously hesitant to implement automated cost-saving recommendations due to the fear of causing production outages.
To overcome this cultural barrier, the remediation workflow must be governed by strict guardrails, risk scoring, and automated validation. The table below outlines a tiered approach to automated remediation based on model confidence and resource criticality:
Remediation Tier | Target Resource Type | Automation Level | Risk Level |
|---|---|---|---|
Tier 1: Non-Disruptive | Unattached storage volumes, old snapshots, orphaned elastic IPs | Fully Autonomous (Immediate deletion or archiving) | Low |
Tier 2: Semi-Autonomous | Dev/Test environment scheduling, down-tiering provisioned IOPS | Scheduled/Policy-Based (Requires owner opt-out window) | Medium |
Tier 3: Collaborative | Production instance downsizing, changing instance families (e.g., Intel to Graviton) | Interactive (Generates Pull Request or ITSM ticket for approval) | High |
By categorizing recommendations this way, organizations can safely automate the "low-hanging fruit" while maintaining rigorous human-in-the-loop validation for critical production infrastructure. This balanced approach builds trust between SREs and FinOps practitioners. SREs can review recommendations with full context, while FinOps teams see continuous, measurable progress in cost reduction.
Furthermore, cloud financial management must be aligned with broader organizational strategies. For technology leaders, utilizing specialized CIO and FinOps leadership solutions ensures that cost optimization initiatives are directly mapped to business units, application owners, and strategic corporate budgets, turning raw technical metrics into actionable business intelligence.
Bridging FinOps and Cloud Security
An overlooked benefit of using deep learning for cloud waste detection is its immediate positive impact on cloud security. Inefficient, orphaned, or forgotten cloud resources are not just financial black holes—they are massive security vulnerabilities.
An unattached virtual machine that was spun up for a temporary test three months ago likely lacks the latest security patches, OS updates, and IAM role restrictions. It sits in your VPC, exposed to the public internet, serving as an ideal entry point for malicious actors. By running deep learning models to identify and terminate these zombie resources, you actively reduce your enterprise's attack surface. FinOps and security are two sides of the same coin: a clean, highly optimized cloud fleet is, by definition, a more secure and governable fleet.
Conclusion: Empowering Your Fleet with CloudAtler
Managing multi-cloud waste at scale is no longer humanly possible using spreadsheets and basic static alerts. The sheer volume of telemetry data, combined with the dynamic nature of modern cloud architectures, demands an intelligent, automated approach. By leveraging deep learning models like Autoencoders and LSTMs, organizations can uncover hidden patterns of inefficiency, correlate multi-resource dependencies, and proactively forecast capacity needs.
However, building and maintaining custom deep learning pipelines across AWS, Azure, GCP, and OCI is a massive engineering undertaking that distracts your teams from core product development. That is why we built CloudAtler.
CloudAtler is the ultimate AI-powered platform that unifies FinOps, cloud security, and automated operations into a single pane of glass. With CloudAtler, you get out-of-the-box deep learning models designed to analyze your entire multi-cloud fleet, identify structural waste, and execute safe, automated remediations. Stop wasting valuable engineering time and capital on unoptimized infrastructure.
All in One Place
Atler Pilot decodes your cloud spend story by bringing monitoring, automation, and intelligent insights together for faster and better cloud operations.