
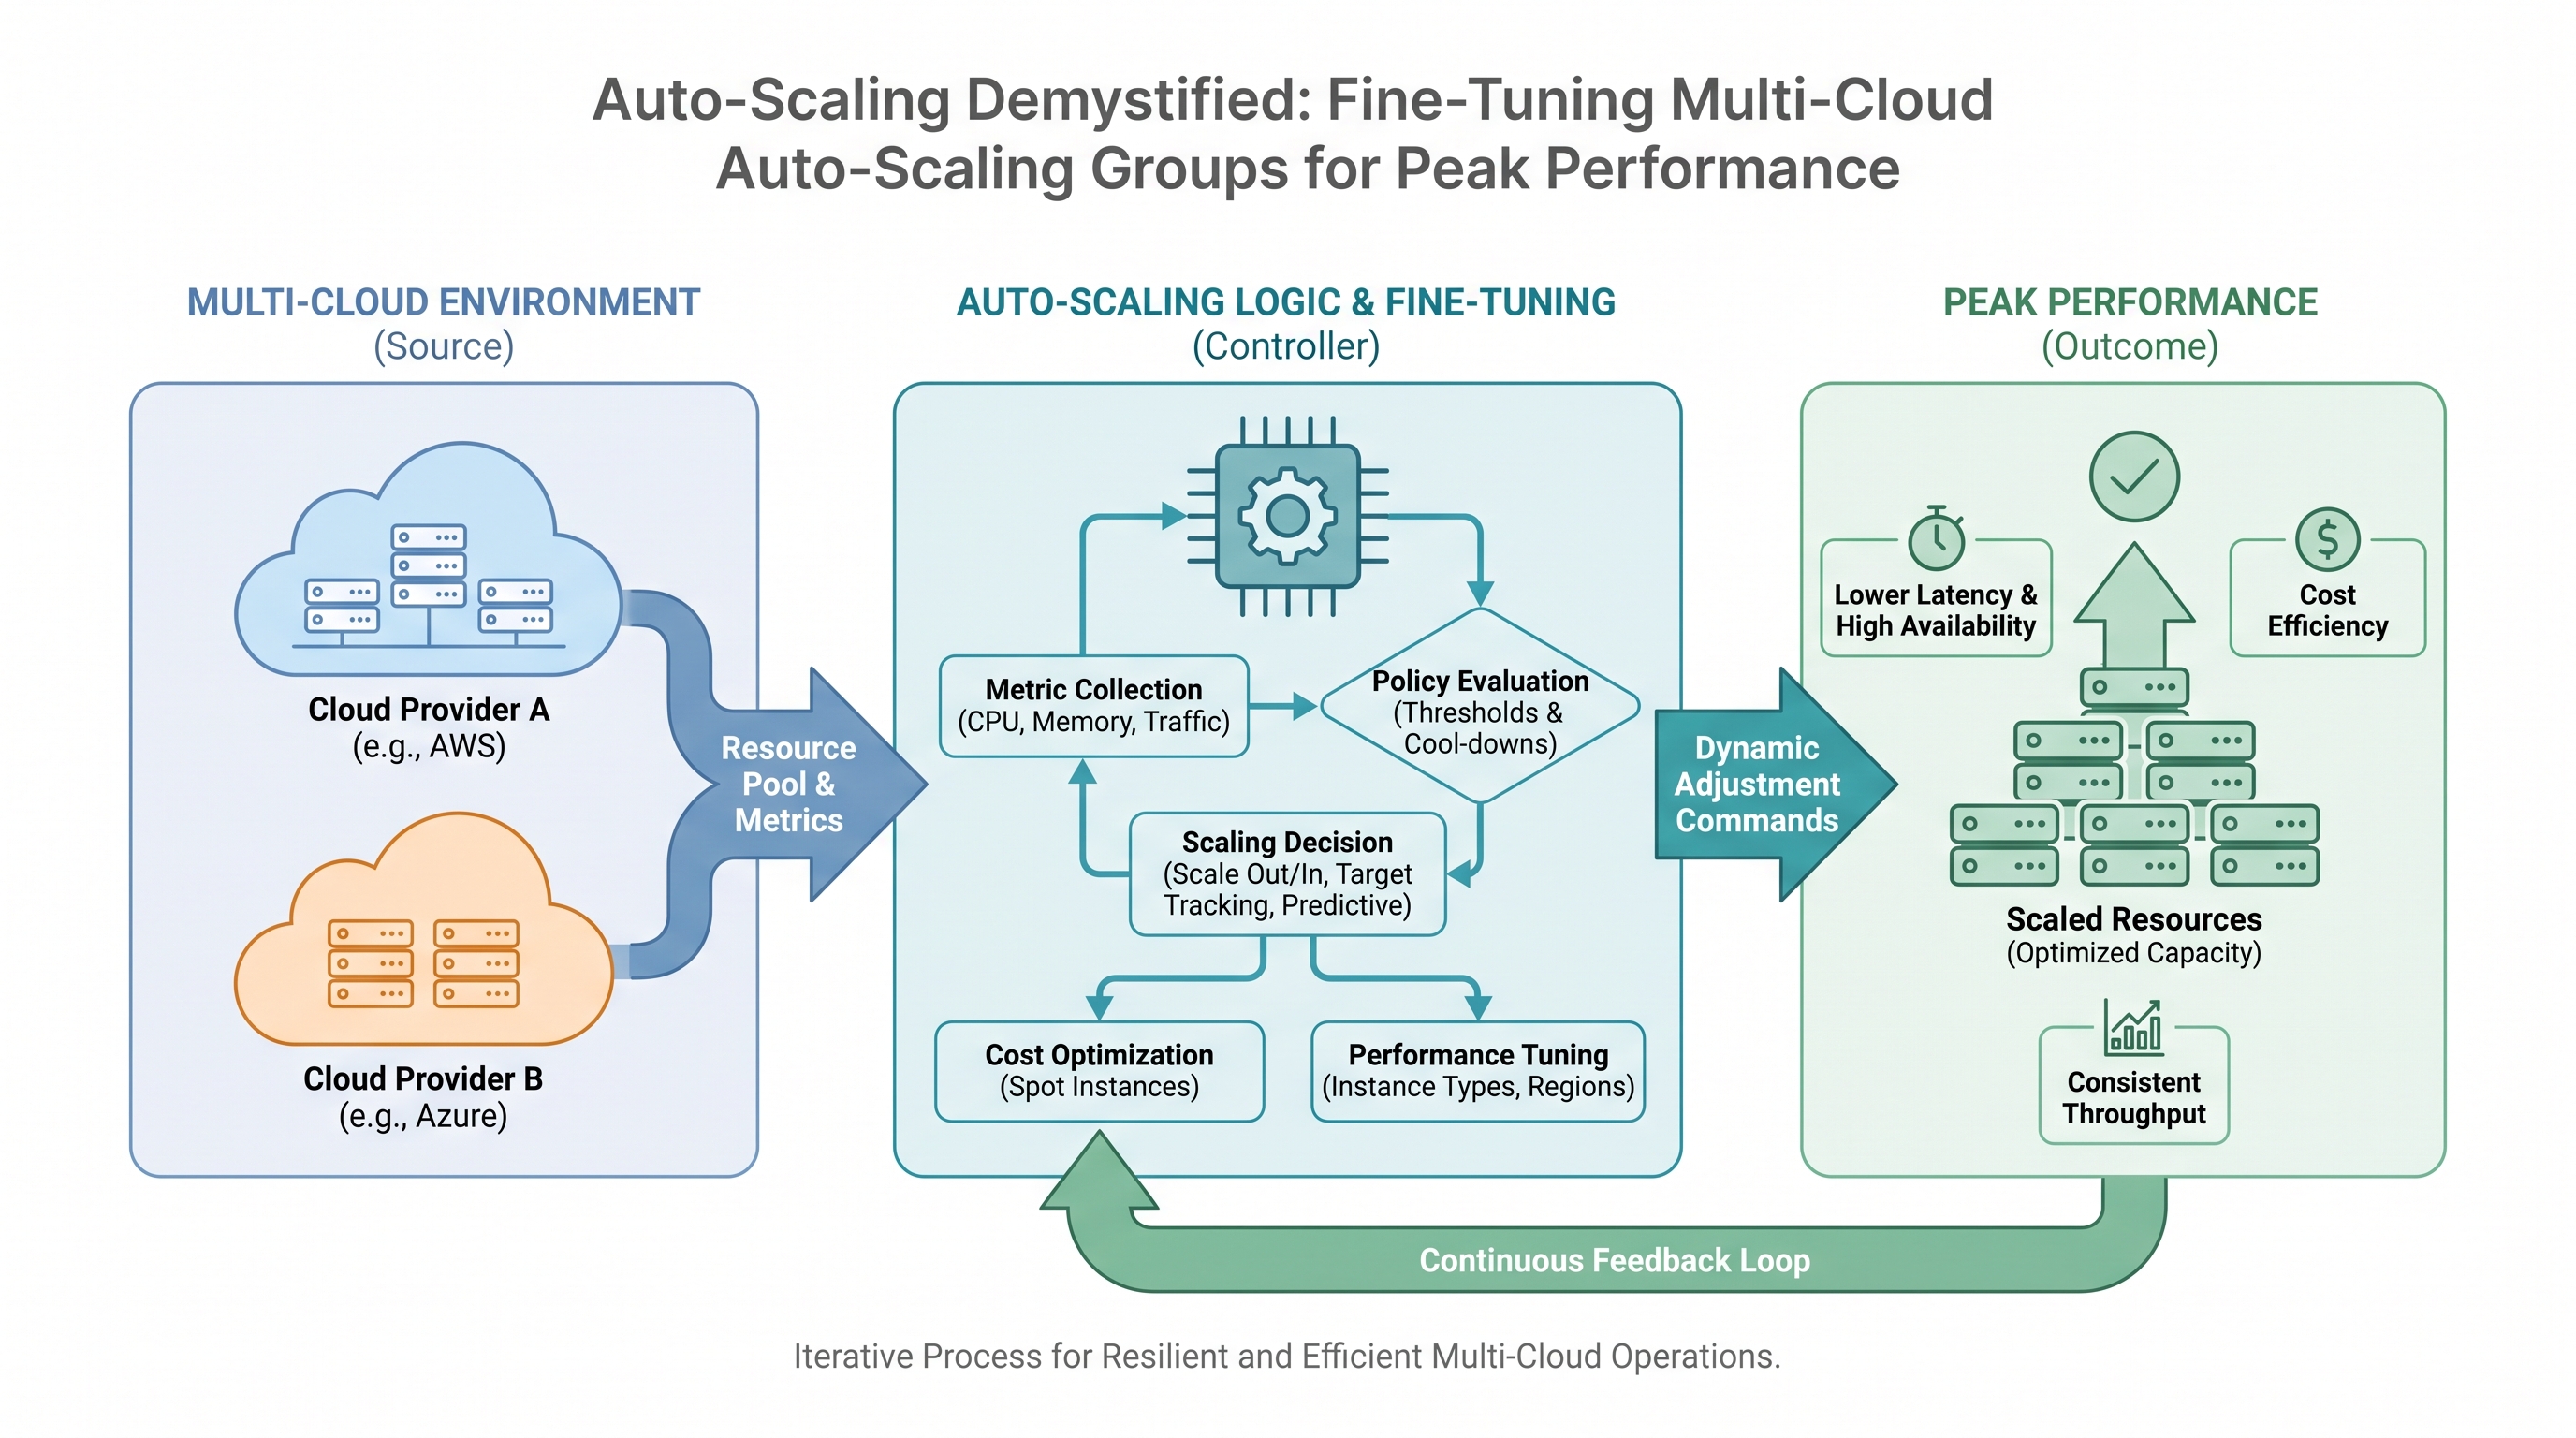
The Multi-Cloud Auto-Scaling Conundrum: Architectures Compared
Modern enterprise architectures are increasingly distributed across multiple public cloud providers to prevent vendor lock-in, meet regional compliance rules, and optimize cost. However, orchestrating elastic infrastructure across these environments introduces a massive operational challenge: non-uniform auto-scaling behavior. While the conceptual goal remains the same—matching resource supply with real-time demand—the underlying engineering, APIs, and execution models differ drastically between the major hyperscalers.
To establish a high-performing multi-cloud infrastructure, we must first dissect how each cloud provider handles dynamic scaling at the virtualization and API control plane levels:
AWS Auto Scaling Groups (ASGs): AWS relies heavily on EC2 Launch Templates and Amazon CloudWatch. ASGs support target tracking, step scaling, and simple scaling policies. The control plane relies on lifecycle hooks to pause instances during creation or termination, allowing for custom bootstrapping or diagnostic collection.
Azure Virtual Machine Scale Sets (VMSS): Azure structures scale sets around a unified model where instances are homogeneous. VMSS supports autoscale settings driven by Azure Monitor metrics. A critical difference is Azure’s upgrade policy models (Manual, Rolling, or Automatic), which dictate how configuration changes propagate to running instances.
Google Cloud Platform (GCP) Managed Instance Groups (MIGs): GCP’s MIGs are highly sophisticated, leveraging a declarative approach. GCP excels at rapid scaling due to its global VPC architecture and fast VM boot times. MIGs use Autoscalers driven by Cloud Monitoring metrics, Pub/Sub queues, or HTTP load balancing utilization.
Oracle Cloud Infrastructure (OCI) Instance Pools: OCI uses Instance Pools coupled with CLI-based or monitoring-based autoscaling configurations. OCI’s performance relies heavily on its bare-metal and virtual machine shapes backed by non-blocking, flat network topologies.
The primary architectural friction point in a multi-cloud strategy is metric latency and scaling policy execution. For instance, AWS CloudWatch metrics default to 5-minute intervals (unless detailed monitoring is enabled for 1-minute intervals), whereas GCP Cloud Monitoring provides sub-minute metric granularity out of the box. If your engineering teams apply identical scaling policies across these clouds without adjusting for telemetry latency, you will experience severe performance discrepancies, resulting in either starved applications or wasted cloud spend.
To mitigate these platform-specific discrepancies, enterprises must implement unified cloud performance management frameworks that normalize telemetry and enforce consistent scaling behaviors across all cloud boundaries.
Why Default Metrics Fail in Modern Architectures
The most common anti-pattern in auto-scaling design is relying solely on default hypervisor-level metrics, such as average CPU Utilization or Network In/Out. While these metrics are easy to configure, they are lagging indicators and poor proxies for actual application health and throughput.
Consider a Java-based Spring Boot microservice running on an AWS EC2 instance. During a sudden traffic surge, the JVM’s garbage collection (GC) process may trigger. If the garbage collector is configured to run concurrently, CPU utilization will spike to 95%. A naive auto-scaling policy configured to scale up when CPU exceeds 70% will immediately spin up new instances. However, the high CPU usage was not caused by an increase in incoming requests, but rather by memory pressure and GC pauses. Adding more instances does not resolve the root cause; it merely increases your bill.
Conversely, consider an I/O-bound Node.js application processing messages from an Apache Kafka topic. The CPU usage of the instances might hover around 15% because the event loop is constantly waiting on database write operations. If the message ingestion rate triples, the database will experience write locks, and the Kafka consumer group lag will swell. Because CPU utilization remains low, the auto-scaling group will not scale out, leading to severe message processing delays and SLA breaches.
Designing a Custom Telemetry Pipeline
To build a resilient auto-scaling strategy, you must expose and scale on application-specific metrics. The most reliable metrics for auto-scaling include:
Request Concurrency / Active Connections: The number of active HTTP/gRPC requests currently being processed by an instance.
Queue Depth / Consumer Lag: The number of unprocessed messages in a queue (e.g., AWS SQS, GCP Pub/Sub, or RabbitMQ) divided by the number of active, healthy instances.
SLA-Based Response Latency: The 95th or 99th percentile (p95/p99) response time of your application endpoints.
Let's look at how to implement a custom queue-based scaling metric. Below is an example of an AWS CloudWatch metric math expression designed to calculate the backlog per instance for an SQS queue. This prevents the "cooldown lag" issue by dynamically accounting for instances that are in the process of launching but are not yet processing messages.
{
  "MetricDataQueries": [
    {
      "Id": "m1",
      "MetricStat": {
        "Metric": {
          "Namespace": "AWS/SQS",
          "MetricName": "ApproximateNumberOfMessagesVisible",
          "Dimensions": [
            {
              "Name": "QueueName",
              "Value": "OrderProcessingQueue"
            }
          ]
        },
        "Period": 60,
        "Stat": "Sum"
      },
      "ReturnData": false
    },
    {
      "Id": "m2",
      "MetricStat": {
        "Metric": {
          "Namespace": "AWS/EC2",
          "MetricName": "GroupInServiceInstances",
          "Dimensions": [
            {
              "Name": "AutoScalingGroupName",
              "Value": "OrderProcessorASG"
            }
          ]
        },
        "Period": 60,
        "Stat": "Average"
      },
      "ReturnData": false
    },
    {
      "Id": "e1",
      "Expression": "m1 / m2",
      "Label": "BacklogPerInstance",
      "ReturnData": true
    }
  ]
}
By scaling on the calculated expression e1 (BacklogPerInstance), the auto-scaling engine knows exactly how many instances are needed to clear the backlog within a target time frame, rather than blindly adding one instance at a time.
Fine-Tuning Cool-Downs, Warm-Ups, and Step Scaling Policies
Once you have selected the correct metrics, you must configure the scaling mechanics to prevent "thrashing." Thrashing occurs when an auto-scaling group repeatedly scales up and down in rapid succession due to volatile metrics. This not only degrades application stability but also incurs massive, unnecessary cloud costs as instances are constantly provisioned and deprovisioned.
Understanding the Lifecycle States
To eliminate thrashing, you must configure three critical parameters: Instance Warm-up, Cooldown Periods, and Scaling Step Adjustments.
1. Instance Warm-up (or Bootstrapping Lag): When a new virtual machine is provisioned, it does not immediately start serving traffic. It must go through hypervisor allocation, OS booting, systemd initialization, container image pulling, and application startup. The Warm-up parameter tells the autoscaling controller to ignore the newly launched instance’s metrics (and exclude it from group averages) until a specified time has elapsed. If your application takes 3 minutes to boot, set your warm-up time to at least 240 seconds. Setting this too low causes the autoscaling engine to assume the previous scale-up action was insufficient, triggering a cascade of unnecessary additional instances.
2. Cooldown Periods: The cooldown period is a lock-out window that begins after a scaling activity completes. During this window, the autoscaling engine suspends further scaling actions unless a highly critical threshold is breached.
Scale-out Cooldown: Typically set shorter (e.g., 60 to 120 seconds) to ensure the system can respond quickly to sustained demand spikes.
Scale-in Cooldown: Must be set significantly longer (e.g., 300 to 600 seconds). This prevents the system from prematurely terminating instances during a temporary lull in traffic, only to boot them up again minutes later when traffic resumes.
To implement this effectively across multi-cloud environments, a deep compute lifecycle analysis must be performed to measure the exact delta between instance provisioning signals and active traffic ingestion across AWS, Azure, and GCP.
Step Scaling vs. Target Tracking
Modern cloud architectures support both Step Scaling and Target Tracking policies. Understanding when to use each is vital for optimal performance:
Scaling Policy Type | Best Use Case | Pros | Cons |
|---|---|---|---|
Target Tracking | Sustained, predictable traffic patterns (e.g., maintaining average CPU at 60%). | Extremely simple to configure; automatically calculates scaling bounds. | Prone to over-provisioning during sudden, massive spikes (e.g., flash sales). |
Step Scaling | Highly volatile workloads or batch processing with predictable step increases. | Allows proportional scaling based on the size of the metric breach. No cooldown lockouts on scale-out. | Requires complex, manual configuration of step boundaries and metric alarms. |
For mission-critical enterprise applications, a hybrid approach is recommended. Implement target tracking for standard daily fluctuations, but overlay step-scaling policies with large step increments to handle extreme anomaly spikes without delay.
Security and Patching in Dynamic, Ephemeral Environments
Auto-scaling groups present a unique security challenge: instances are ephemeral. Traditional security operations, which rely on static IP addresses, manual vulnerability scanning, and persistent agents, break down entirely when instances live for only hours or days.
The Golden Image Pipeline vs. Just-in-Time Bootstrapping
When configuring your auto-scaling groups, you must choose between two primary machine image strategies:
Golden Images (Thick AMIs/VHDs): All application dependencies, security agents, and configurations are pre-packaged into a custom machine image.
Pros: Extremely fast boot times (under 60 seconds), highly predictable.
Cons: High maintenance overhead; any patch requires rebuilding and rolling out new images.Just-in-Time Bootstrapping (Thin Images): A minimal, cloud-provided base OS image is used, and a user-data startup script downloads and installs application code and dependencies at boot time.
Pros: Always uses the latest base OS patches.
Cons: Slow boot times (often 5+ minutes), highly vulnerable to network failures during boot (e.g., a failed package repository mirror will block scaling).
From a security and operational resilience perspective, the Golden Image approach is superior. However, it requires a fully automated CI/CD pipeline (using tools like HashiCorp Packer and Ansible) to rebuild images immediately when new CVEs are discovered. To secure these dynamic environments, organizations must deploy a robust cloud security management strategy that integrates directly with image registries and runtime environments.
Zero-Downtime Patch Rollouts in Auto-Scaling Groups
When a security patch is issued, you must update the running instances in your auto-scaling groups without causing downtime or performance degradation. This is achieved through a structured rolling update policy.
For example, in an AWS ASG, you can initiate an Instance Refresh. The configuration below demonstrates a rolling update that ensures at least 70% of the group's capacity remains healthy and active during the replacement process:
{
  "AutoScalingGroupName": "ProductionAppASG",
  "Strategy": "Rolling",
  "Preferences": {
    "MinHealthyPercentage": 70,
    "InstanceWarmup": 300,
    "SkipMatching": true,
    "ScaleInLimitPercent": 30
  }
}
This configuration enforces that only 30% of the instances are terminated and replaced at any given time. The autoscaler waits for the new instances to pass their 300-second warmup and associated load balancer health checks before moving on to terminate the next batch of outdated instances. This completely eliminates the risk of capacity starvation during emergency security patching.
Multi-Cloud FinOps Optimization: The Mixed-Instance Strategy
Auto-scaling is not just a performance tool; it is one of the most powerful cost-optimization mechanisms in a Cloud Financial Operations (FinOps) practitioner's arsenal. However, running 100% On-Demand instances in your auto-scaling groups is a massive waste of capital.
Leveraging Spot and Preemptible Instances Safely
Spot instances (AWS) and Preemptible VMs (GCP/Azure) offer up to a 90% discount compared to On-Demand pricing. The caveat is that the cloud provider can reclaim these instances with very short notice (2 minutes on AWS, 30 seconds on Azure). To leverage these cost savings without sacrificing application availability, you must implement a Mixed-Instance Auto-Scaling Group.
The ideal architectural pattern is to maintain a baseline of highly predictable, reserved, or Savings Plan-backed On-Demand instances, and scale out using a diversified pool of Spot instances. If Spot capacity is reclaimed, the autoscaler should automatically fall back to On-Demand instances to prevent service disruption.
FinOps Best Practice: AWS ASG Mixed Instances Policy
Configure your ASG to use the capacity-optimized-prioritized allocation strategy. This instructs AWS to launch Spot instances from the pool with the lowest risk of interruption, significantly increasing application stability.
Below is an example of an infrastructure-as-code configuration (expressed in AWS CloudFormation style JSON) defining a mixed-instances policy. It establishes a baseline of 2 On-Demand instances, and specifies a 70/30 split between Spot and On-Demand for any instances provisioned above that baseline:
{
  "MixedInstancesPolicy": {
    "LaunchTemplate": {
      "LaunchTemplateSpecification": {
        "LaunchTemplateId": "lt-0123456789abcdef0",
        "Version": "$Latest"
      },
      "Overrides": [
        { "InstanceType": "c5.large" },
        { "InstanceType": "c5d.large" },
        { "InstanceType": "c4.large" }
      ]
    },
    "InstancesDistribution": {
      "OnDemandBaseCapacity": 2,
      "OnDemandPercentageAboveBaseCapacity": 30,
      "SpotAllocationStrategy": "capacity-optimized"
    }
  }
}
By diversifying across multiple instance types (e.g., c5.large, c5d.large, and c4.large), you drastically reduce the probability that a sudden capacity crunch in a single hardware pool will trigger a mass termination of your spot instances.
To monitor the financial impact of these dynamic scaling events, organizations must feed real-time scaling telemetry into a centralized financial command center. This ensures that cost optimization decisions are made with complete visibility into performance SLAs and business unit budgets.
Unifying Multi-Cloud Auto-Scaling with CloudAtler
While public cloud providers offer native tools to manage auto-scaling, they operate in silos. Your AWS ASGs do not communicate with your Azure VMSS or GCP MIGs. This lack of coordination leads to fragmented monitoring, inconsistent security posture, and runaway cloud spend as teams over-provision to compensate for multi-cloud complexity.
This is where CloudAtler transforms your operations. As an AI-powered platform, CloudAtler unifies FinOps, cloud security, and automated operations across AWS, Azure, GCP, and Oracle environments into a single pane of glass.
CloudAtler’s advanced engine provides:
Cross-Cloud Predictive Scaling: Utilizing our proprietary predictive monitoring and operations capabilities, CloudAtler analyzes historical traffic patterns across your entire multi-cloud estate. It proactively scales your groups before traffic spikes hit, eliminating the reactive boot-time delay of native autoscalers.
Continuous FinOps Arbitrage: CloudAtler constantly evaluates spot availability, reservation coverage, and performance metrics across clouds, dynamically recommending or executing real-time instance type swaps to maximize cost savings without compromising SLAs.
Automated Security and Patch Governance: Ensure that every dynamic instance launched across any cloud is instantly hardened, patched, and compliant with your corporate security baselines, without human intervention.
Stop managing your cloud infrastructure in silos. Bring predictability, enterprise-grade security, and massive cost efficiency to your dynamic workloads today.
All in One Place
Atler Pilot decodes your cloud spend story by bringing monitoring, automation, and intelligent insights together for faster and better cloud operations.