
The Problem with the Spreadsheet
Every quarter, a familiar ritual occurs in IT finance departments globally. An analyst exports the last three months of cloud billing data into Excel, drags the trendline out for the next four quarters, adds a 15% "buffer for growth," and presents this as the cloud budget forecast. And almost every quarter, that forecast is wrong.
Cloud spend is inherently volatile. It does not behave like traditional datacenter depreciation. It fluctuates based on user traffic, marketing campaigns, unoptimized code deployments, and complex discounting structures. Attempting to predict this volatility using simple linear extrapolation is financial malpractice. When forecasts are wildly inaccurate, organizations either hoard capital unnecessarily (opportunity cost) or face budget crises that halt engineering momentum.
Accurate FinOps requires moving beyond guesswork. This guide outlines how to elevate cloud budget forecasting from simple spreadsheet math to robust statistical modeling integrated with business drivers.
The Forecasting Maturity Model
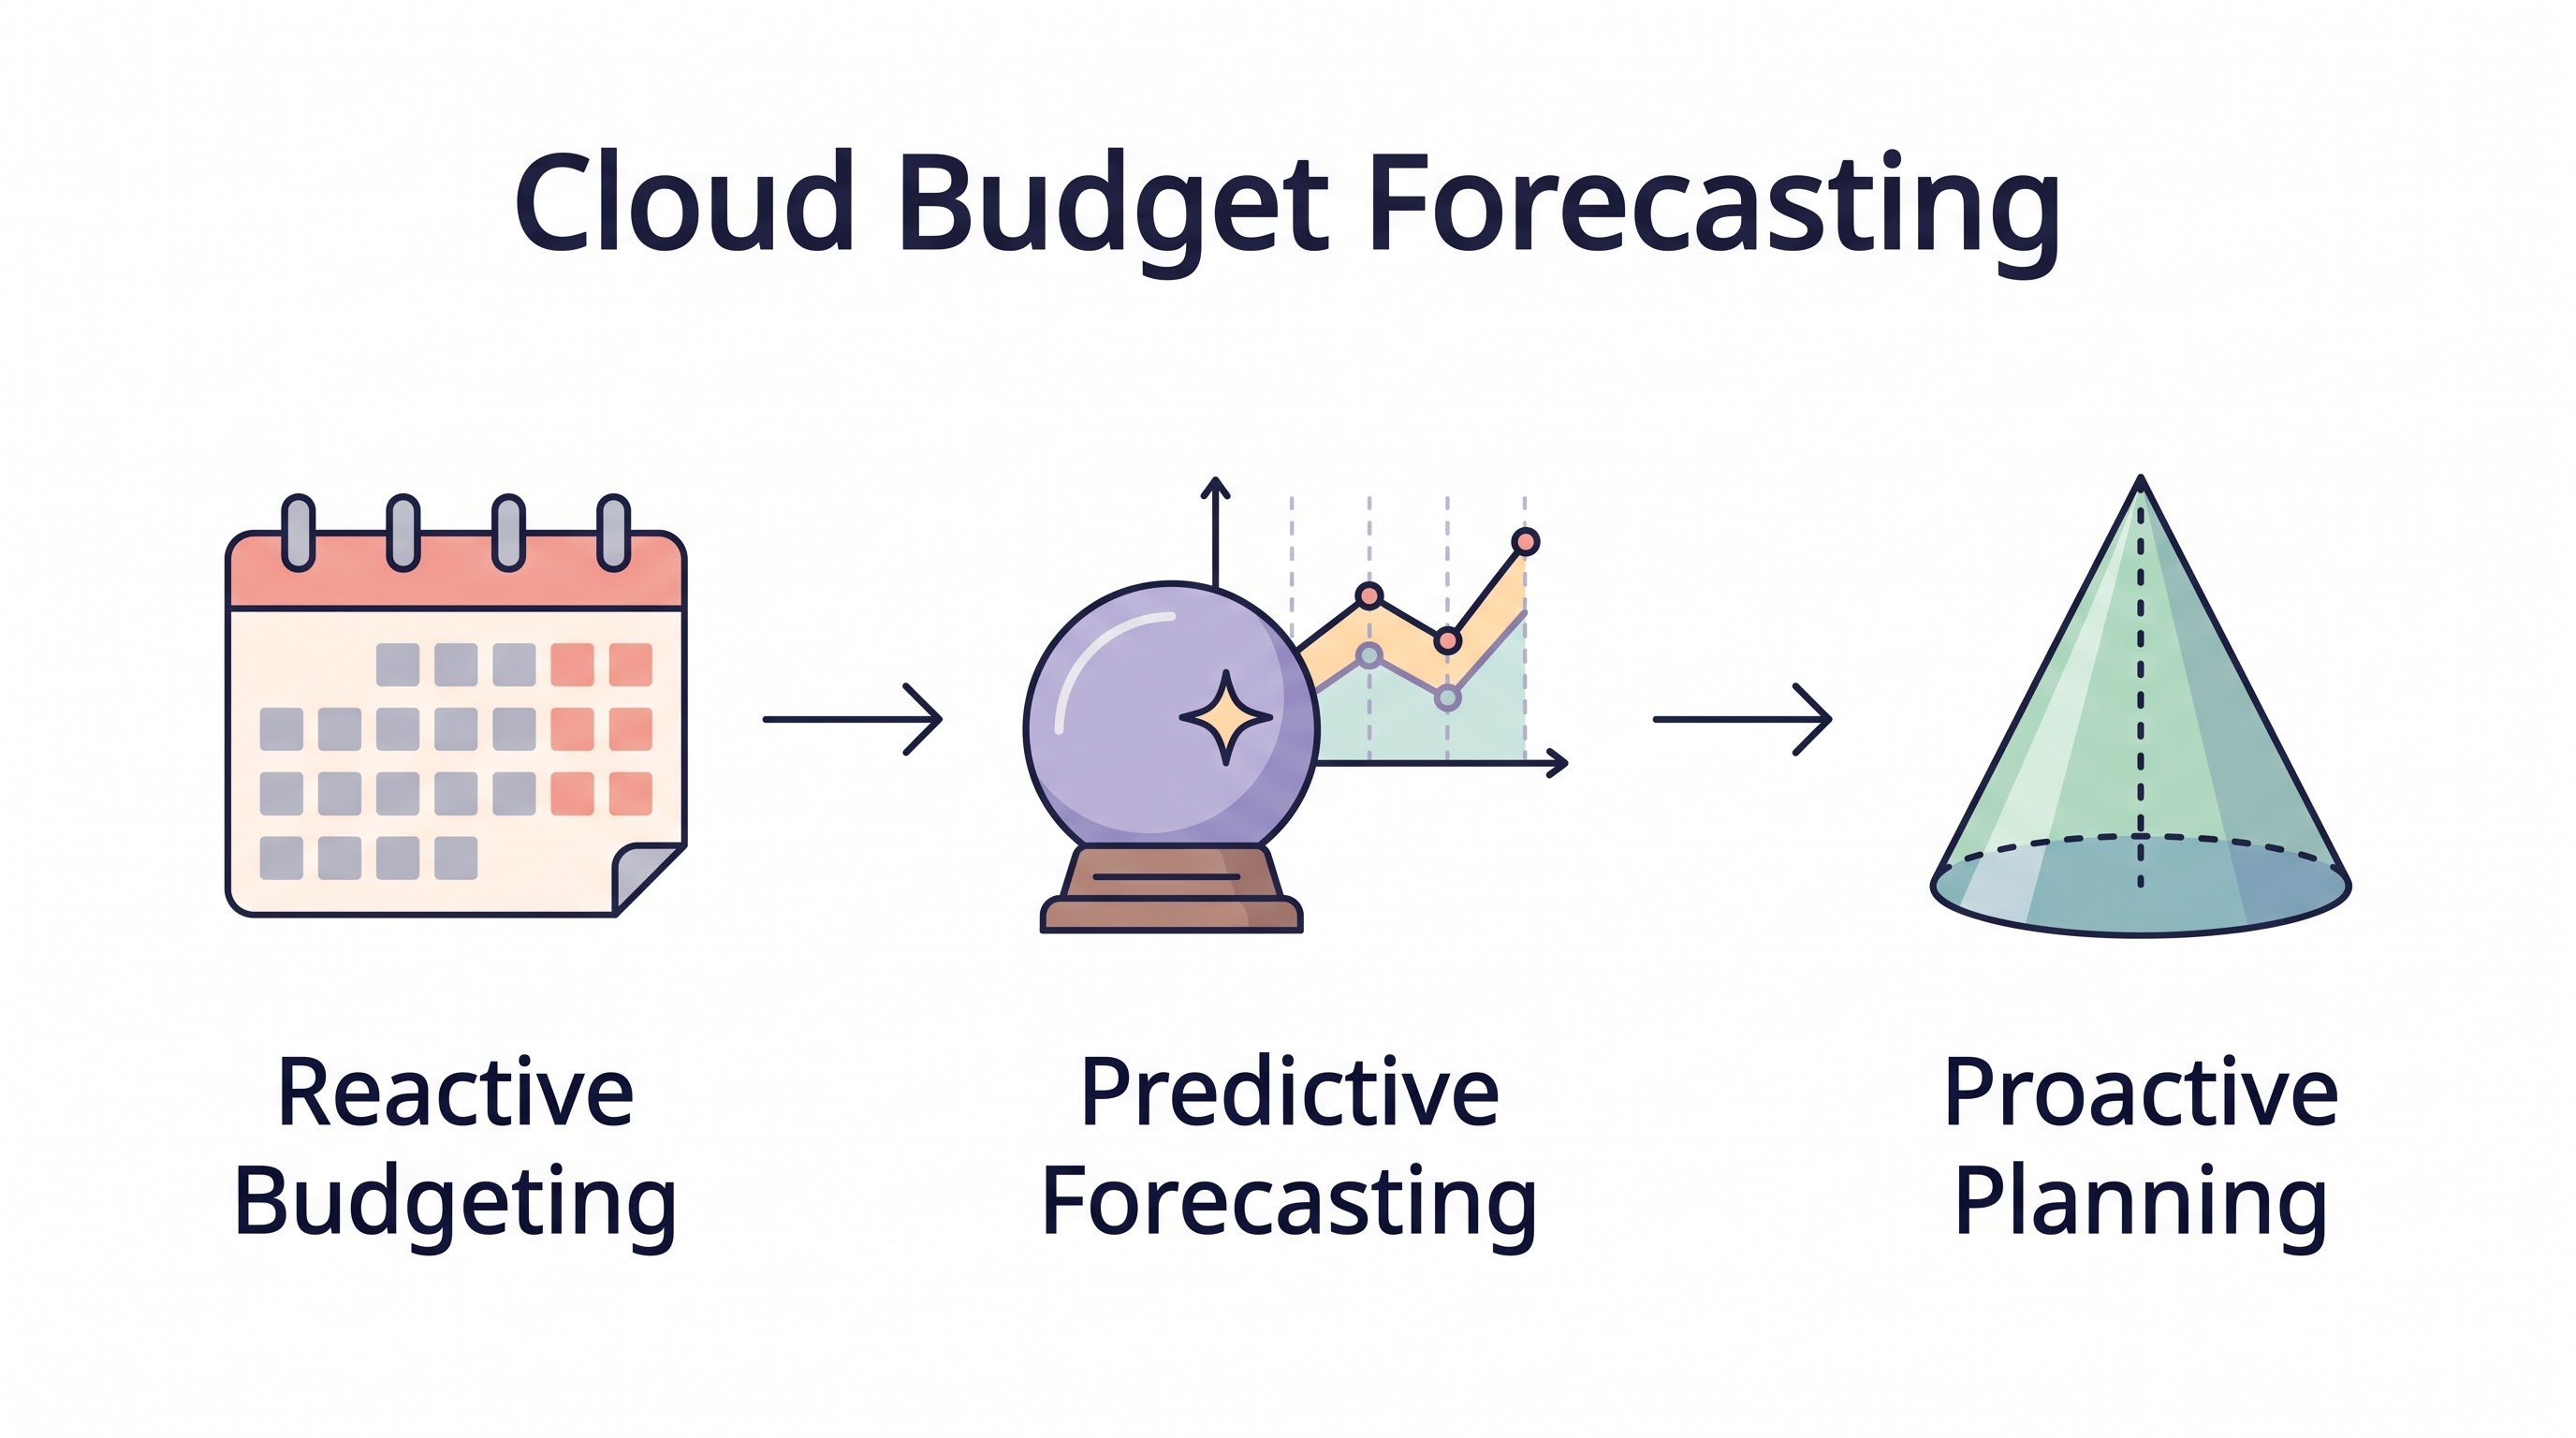
Forecasting maturity progresses through three distinct phases. Most organizations are stuck in Phase 1; the goal is to systematically build the data pipelines and cross-functional relationships required to reach Phase 3.
Phase 1: Run-Rate and Trend-Based Forecasting
This is the baseline. It relies entirely on historical billing data.
Run-Rate: Takes the current month's spend and multiplies it by 12. This is highly inaccurate as it ignores seasonality and growth.
Trend-Based (Time Series): Uses simple moving averages or linear regression on historical data. AWS Cost Explorer's built-in forecasting uses this methodology.
The Limitation: Trend-based forecasting assumes the future will look exactly like the past. It cannot predict the impact of a new product launch, a major architecture refactor, or a sudden spike in customer acquisition. It is driving by looking exclusively in the rearview mirror.
Phase 2: Business Driver-Based Forecasting
This phase represents a massive leap in accuracy. It abandons the assumption that time is the primary driver of cloud spend, recognizing instead that business activity drives cloud spend.
Driver-based forecasting connects infrastructure metrics to business metrics—the essence of Cloud Unit Economics. The formula shifts from "Spend = Last Month + 5%" to "Spend = (Projected User Growth) * (Cost Per User) + Fixed Base Costs."
Implementation Steps:
Identify the Drivers: Determine what metric dictates your variable spend. Is it Daily Active Users (DAU), transactions processed, or petabytes stored?
Calculate the Unit Cost: Determine the marginal cloud cost of one unit of that driver.
Incorporate the Product Roadmap: The FinOps team must meet with Product and Marketing. If Marketing is running a Super Bowl ad expected to drive 10x traffic, the forecast must ingest that driver data. If Engineering plans to migrate a database to a cheaper managed service in Q3, that cost reduction must be factored in.
Driver-based forecasting requires a culture of cross-functional collaboration. FinOps cannot forecast accurately in a vacuum.
Phase 3: Machine Learning and Statistical Models
At enterprise scale, with dozens of business units and thousands of cloud services, manual driver-based forecasting becomes unwieldy. Phase 3 introduces AI cloud cost prediction and advanced statistical modeling.
Instead of relying on simple linear models, organizations deploy algorithms like ARIMA (AutoRegressive Integrated Moving Average) or Prophet (developed by Meta). These models excel at handling:
Strong Seasonality: Automatically identifying and adjusting for daily (traffic drops at night), weekly (lower usage on weekends), and annual (Black Friday retail spikes) patterns.
Multi-Variate Analysis: Ingesting multiple business drivers simultaneously (e.g., analyzing the combined impact of user growth, feature rollout schedules, and historical seasonal trends) to generate a probabilistic forecast.
These models do not output a single number; they output a confidence interval (e.g., "We are 90% confident Q3 spend will be between $1.2M and $1.4M"). This allows finance teams to understand and manage risk.
Managing Variance and The Feedback Loop
A forecast is a living document. The most critical part of the forecasting process is the variance analysis conducted at the end of each month.
When actual spend deviates from the forecast by more than a defined threshold (e.g., 5%), the FinOps team must perform a root cause analysis. Did the business driver deviate from expectations (we acquired more users than planned)? Or did the unit cost deviate (a code change made processing a transaction 20% more expensive)?
This feedback loop is crucial. It either highlights a cloud cost anomaly that needs immediate remediation, or it refines the forecasting model for the next cycle.
Factoring in Commitments and Amortization
A frequent stumbling block in forecasting is the handling of commitment discounts (Reserved Instances and Savings Plans).
If you purchase a $1M All-Upfront Savings Plan in January, your cash flow takes a massive hit in Q1, but your amortized infrastructure cost is smoothed over the term. Forecasting must align with how the finance department recognizes expenses (usually amortized). Furthermore, the forecast must account for upcoming commitment expirations; if 40% of your RIs expire in November and are not renewed, the December forecast must reflect the sudden reversion to on-demand rates.
The Role of Advanced FinOps Platforms
Building machine learning pipelines for cloud forecasting in-house is a significant engineering investment. For most organizations, leveraging a dedicated FinOps platform is the more practical route.
Platforms like CloudAtler natively ingest billing data across AWS, Azure, and GCP, apply ML models to detect seasonality, and allow users to overlay business events (e.g., "Add 15% to traffic in August for back-to-school"). Crucially, they automate the variance analysis, immediately flagging when a specific service or team deviates from their modeled trajectory.
Key Takeaway
Stop relying on simple run-rate extrapolation. Mature cloud budget forecasting connects infrastructure costs directly to business drivers (Unit Economics) and incorporates product roadmaps. By progressing toward statistical models that account for seasonality and provide confidence intervals, organizations can transform cloud spend from an unpredictable risk into a managed, strategic investment.
All in One Place
Atler Pilot decodes your cloud spend story by bringing monitoring, automation, and intelligent insights together for faster and better cloud operations.