
The Container Cost Attribution Crisis: Why Standard Cloud Billing Fails
In the era of static virtual machines, cloud cost allocation was a straightforward exercise in resource tagging. A virtual machine (VM) had a clear owner, a defined life cycle, and a single virtual hardware configuration. If an EC2 instance or an Azure VM was tagged with CostCenter: Marketing, 100% of that resource's cost was booked directly to the marketing department's ledger. The cloud provider's monthly billing CSV or parquet file was the source of truth.
The widespread adoption of container orchestrators like Kubernetes (EKS, AKS, GKE) and managed container platforms has shattered this simplistic model. Kubernetes acts as a multi-tenant operating system for the cloud, abstracting physical and virtual infrastructure into a shared pool of compute, memory, storage, and network resources. Within a single Kubernetes cluster, hundreds of microservices owned by dozens of different engineering teams run, scale, and terminate concurrently on a shared set of underlying virtual machine nodes.
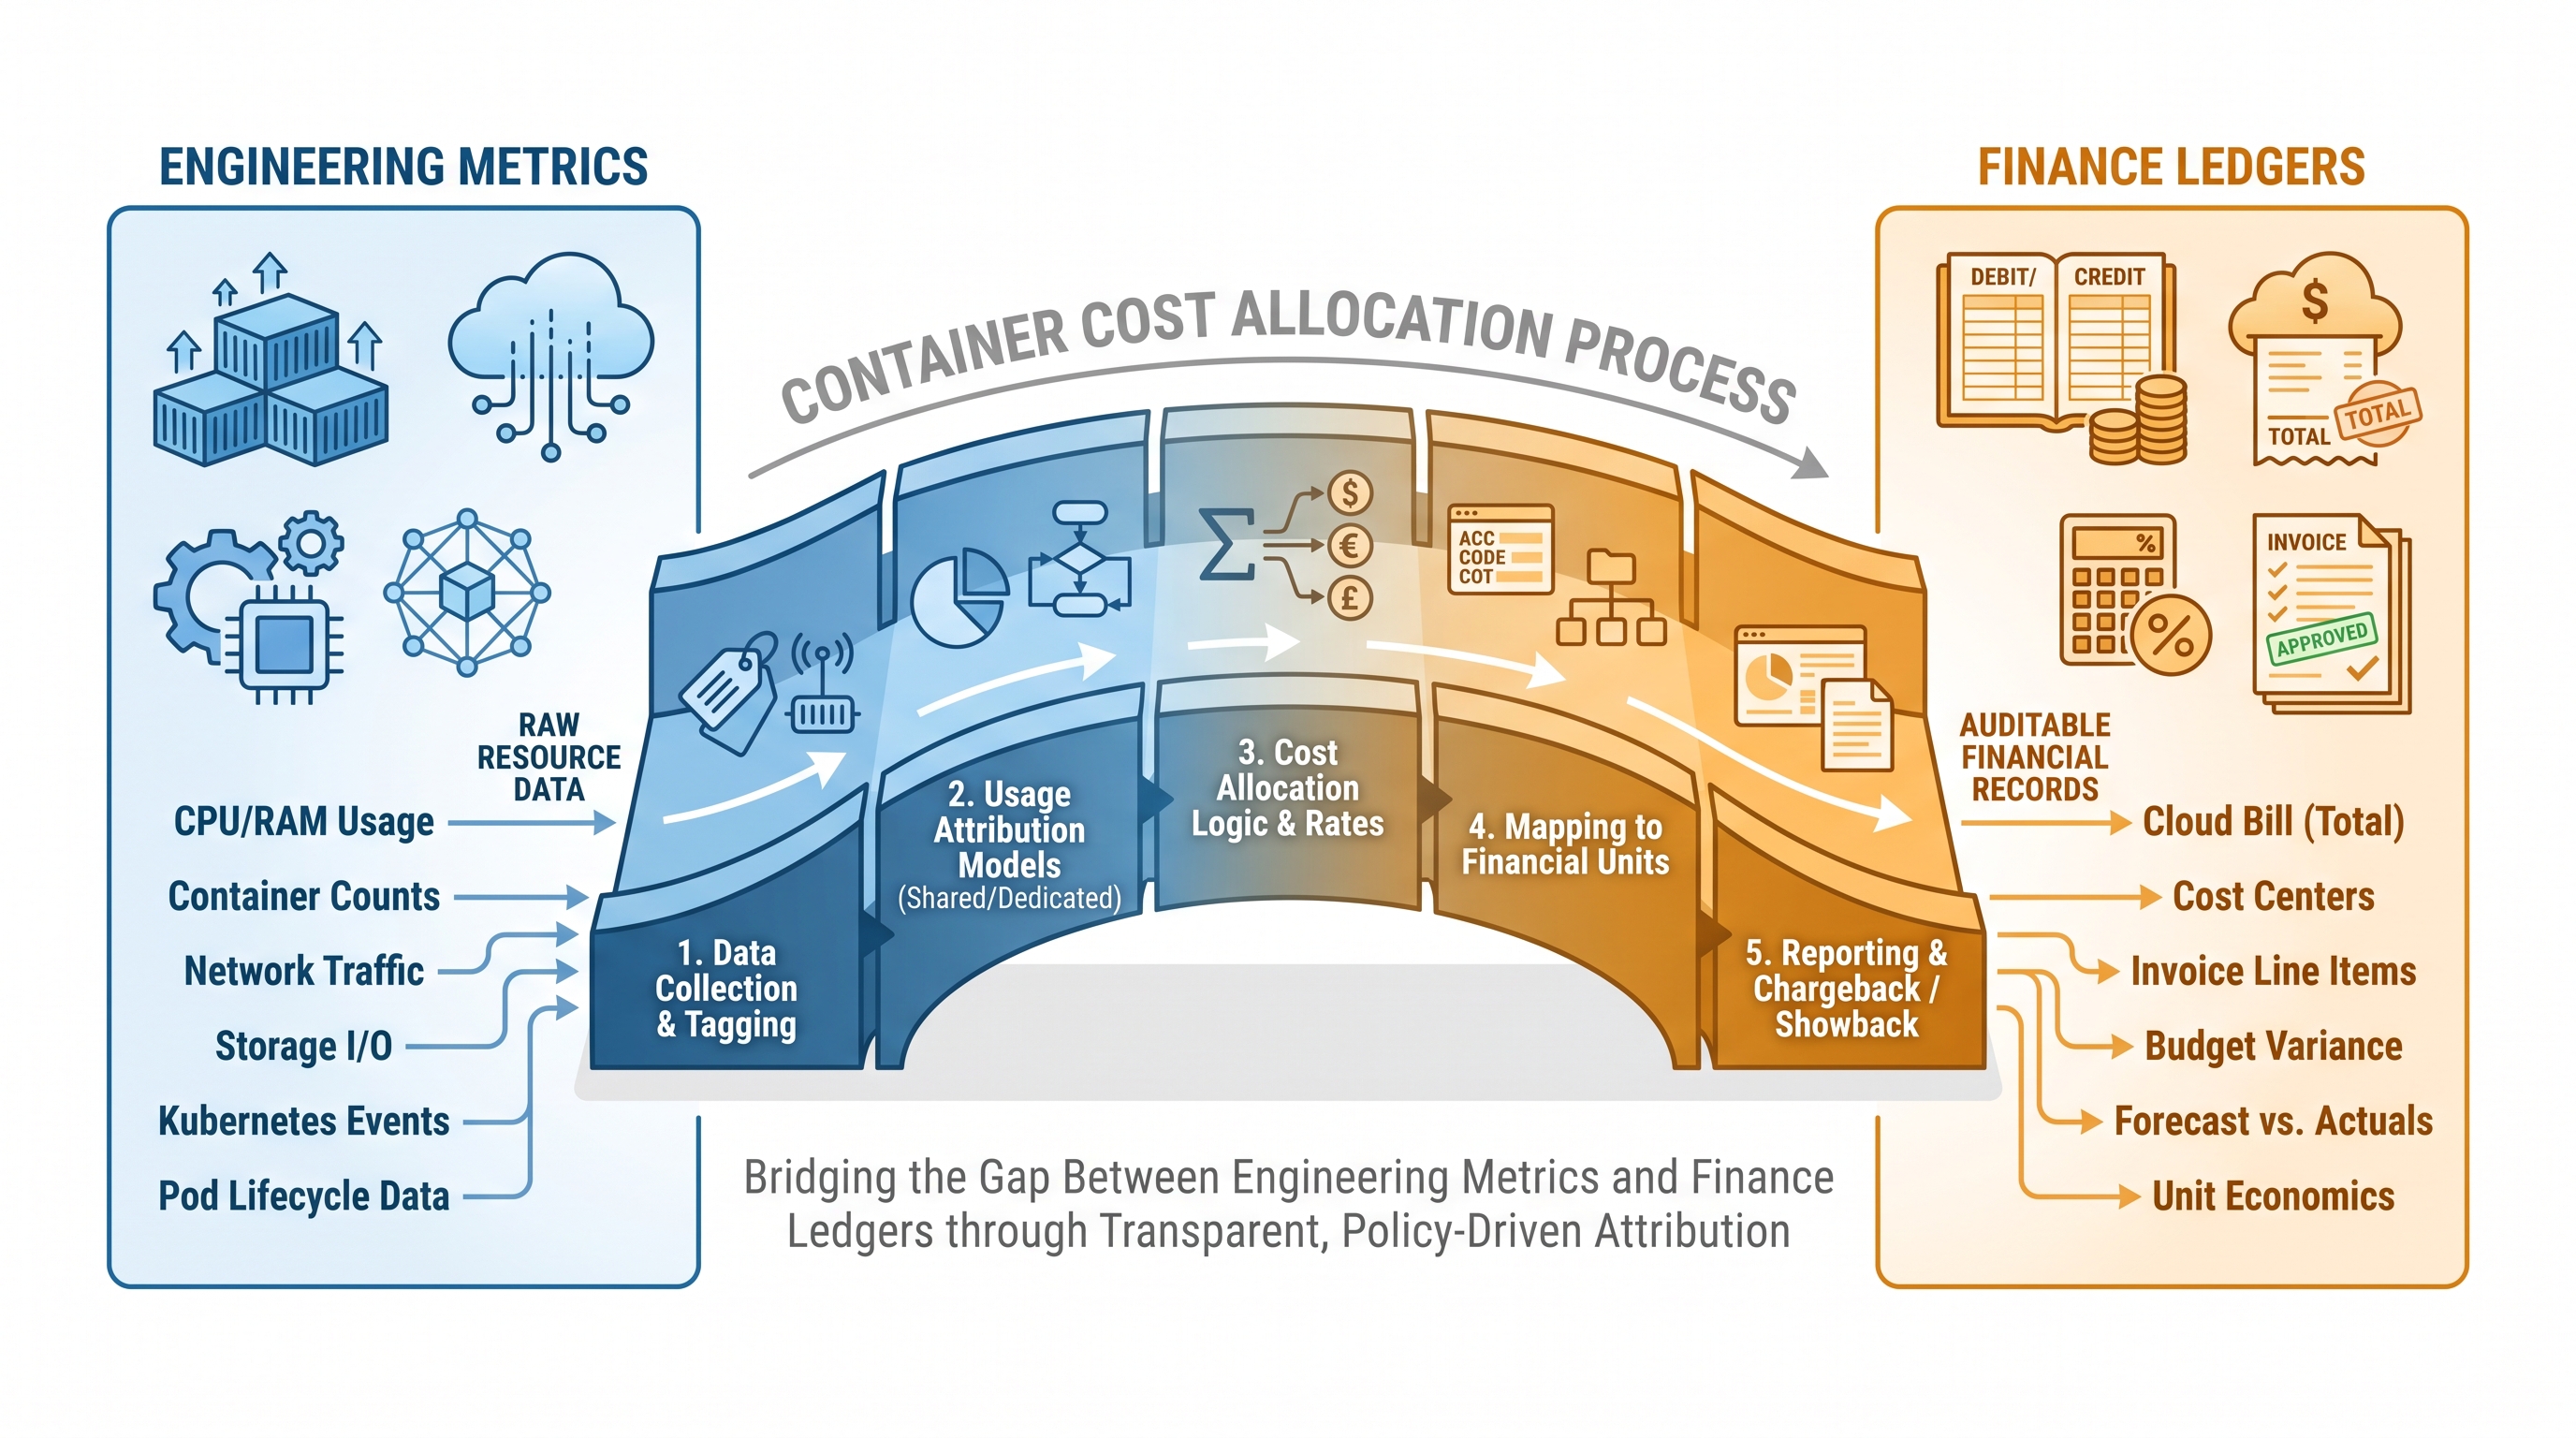
From the perspective of the cloud provider's billing ledger, all that is visible is the cost of the underlying virtual machines (the Kubernetes worker nodes), the managed control plane fees, and attached storage volumes. The billing file sees a collection of m5.2xlarge instances, but it has zero visibility into the namespaces, pods, deployments, or custom resources running inside those instances. If Team A's microservice consumes 90% of a node's CPU and memory, while Team B's microservice consumes only 10%, a standard cloud billing export will still split the node's cost arbitrarily or leave it completely unallocated. This creates a severe visibility gap between engineering metrics (CPU millicores, GiB of RAM requested) and financial ledgers (dollars spent, amortized reservations, and enterprise discount plans).
The Core Metrics of Container Cost Allocation
To bridge this gap, organizations must build an allocation model that translates Kubernetes-native resource metrics into financial value. This requires a deep understanding of three distinct resource metrics: Requests, Limits, and Actual Usage.
1. Resource Requests (The Reservation Floor)
In Kubernetes, a container's resources.requests defines the minimum amount of CPU and memory the orchestrator guarantees to the container. The Kubernetes scheduler uses these request values to decide which node can accommodate the pod. If a pod requests 2 vCPUs and 4 GiB of RAM, the scheduler reserves that capacity on a node, making it unavailable to other pods, regardless of whether the container actively uses those resources. Because requests directly drive the scaling and provisioning of the underlying nodes, Resource Requests are the primary metric used for baseline cost allocation.
2. Resource Limits (The Performance Ceiling)
The resources.limits defines the maximum amount of CPU and memory a container is allowed to consume. While memory limits are strictly enforced (resulting in Out-Of-Memory [OOM] kills if exceeded), CPU limits are enforced via throttling. Limits do not directly impact scheduling capacity unless the scheduler is overcommitted, but they dictate the risk profile and potential burst capacity of the application. Allocating costs solely based on limits is mathematically flawed because multiple pods can have limits that collectively exceed the physical capacity of the node (overcommit).
3. Actual Usage (The Real-Time Consumption)
Actual usage represents the real-time telemetry of CPU cycles and memory bytes consumed by the running container. This is typically collected via metrics servers, Prometheus, or cgroups. While actual usage is highly valuable for engineering rightsizing exercises, using it as the sole basis for financial chargeback can be problematic. If a team requests 8 vCPUs for a critical service but only uses 1 vCPU on average, allocating cost based only on the 1 vCPU of actual usage leaves 7 vCPUs of "idle" or "slack" capacity unallocated. This unallocated cost must still be paid for, creating a deficit in the financial ledger.
The Mathematical Model for Pod Cost Allocation
To accurately allocate the cost of a shared node to the individual pods running on it, we must calculate the cost of a pod based on its relative resource footprint. Because nodes provide both CPU and memory, we must first establish the cost ratio between CPU and memory for each node type. This is often derived from the cloud provider's pricing for custom virtual machines or by analyzing the price differences between compute-optimized and memory-optimized node families.
Let us define the total cost of a worker node over a given time frame $T$ as $C_{node}$. We split this cost into a CPU allocation factor ($W_{cpu}$) and a Memory allocation factor ($W_{mem}$), such that:
Wcpu + Wmem = 1
Typically, a standard ratio of 50:50 or 60:40 (CPU to Memory) is applied based on the underlying hardware profile. The cost allocated to a specific pod ($C_{pod}$) running on that node is calculated using the following formula:
C_pod = C_node [ W_cpu (CPU_req_pod / CPU_total_node) + W_mem * (Mem_req_pod / Mem_total_node) ]
Where:
CPU_req_podis the CPU request of the pod (in millicores).CPU_total_nodeis the total allocatable CPU capacity of the node.Mem_req_podis the memory request of the pod (in bytes).Mem_total_nodeis the total allocatable memory capacity of the node.
This formula ensures that the entire cost of the node's scheduled capacity is proportionally distributed among the active workloads based on their reservations. However, this model must be expanded to handle idle capacity, system overhead, and shared services.
Architectural Implementation: Building a Cost Allocation Pipeline
Implementing a robust container cost allocation system requires a multi-stage telemetry and data-processing pipeline. Organizations cannot rely on simple scripts; they need an enterprise-grade pipeline that merges real-time Kubernetes cluster metrics with cloud billing data APIs.
The diagram below outlines the standard architecture of a modern container cost allocation pipeline:
Container Cost Telemetry & Billing Pipeline
[ Kubernetes Cluster ]
  ├── Pods, Namespaces, Nodes (Metadata)
  └── cgroups / Kubelet Metrics
            │
            ▼
[ Prometheus / OpenTelemetry Collector ] (Scrapes metrics every 15-60s)
            │
            ▼ (PromQL / Metric Export)
[ Cost Allocation Engine (e.g., OpenCost, Kubecost) ]
            │
            ├─◄─ [ Cloud Billing API / BigQuery / AWS CUR ] (Ingests amortized, discounted node costs)
            │
            ▼
[ Normalized Cost Data Store ] (Parquet / SQL Database)
            │
            ├─► BI Tools (Grafana, Tableau)
            └─► Financial Ledger Reconciliation (ERP, SAP)
Step 1: Telemetry Collection
The foundation of the pipeline is high-resolution telemetry. Agents running within the Kubernetes cluster (such as Prometheus, OpenTelemetry, or metric servers) must continuously scrape resource utilization and allocation metrics. The key metrics required include:
kube_pod_container_resource_requests: Tracks the CPU and memory requests configured for each container.kube_pod_container_resource_limits: Tracks the resource limits.container_cpu_usage_seconds_total: Tracks active CPU consumption.container_memory_working_set_bytes: Tracks the active memory footprint of the containers.kube_node_labelsandkube_pod_labels: Captures metadata, namespaces, and tags critical for financial attribution.
Step 2: Metadata Enrichment and Tagging
Raw metrics are useless without context. To map a pod to a business unit, the pipeline must ingest Kubernetes metadata (labels and namespaces). This is where automated governance becomes critical. If resources are not tagged properly at the Kubernetes level, costs end up in an unallocated "black hole." Implementing automated tagging and resource classification ensures that every namespace, deployment, and pod is injected with the required cost-center metadata at deployment time via admission controllers or mutation webhooks.
Step 3: Ingesting Cloud Provider Billing Data
To convert CPU and memory metrics into exact currency values, the allocation engine must query the cloud provider's billing APIs in real-time. For example, in AWS, this involves querying the AWS Cost and Usage Report (CUR) or the AWS Price List API. The engine maps the physical ProviderID of each Kubernetes node to its corresponding entry in the billing report. This allows the system to factor in the exact cost of the node, taking into account:
On-Demand rates versus Spot Instance market prices.
Regional pricing variations and data transfer costs.
Amortized Reserved Instances (RIs) and Savings Plans discounts.
Step 4: Data Normalization and Storage
The raw metrics and billing data are joined, normalized, and written to a high-performance database (such as ClickHouse, Amazon Athena, or Google BigQuery). This structured dataset serves as the single source of truth for both engineering and finance. It enables the execution of complex SQL queries to generate chargeback reports, calculate unit economics, and power a unified dashboard for cloud management.
Solving the Idle and Unallocated Cost Dilemma
One of the most complex challenges in container cost allocation is handling "idle" capacity and unallocated cluster overhead. In any healthy Kubernetes cluster, there is a significant delta between the total physical capacity of the hardware and the resources actually requested or used by active applications. This delta is composed of several layers:
Cost Layer | Description | FinOps Allocation Best Practice |
|---|---|---|
System Overhead | Resources reserved for system daemons (kubelet, container runtime, OS background processes). | Distribute proportionally across all active tenant pods as a flat percentage tax. |
Shared Platform Services | Cluster-wide services like ingress controllers (Istio, NGINX), logging agents (Fluentbit), and monitoring (Prometheus). | Allocate to a central platform IT budget, or split proportionally among applications based on their transaction volume or traffic. |
Node-Level Idle Capacity (Slack) | The difference between a container's resource requests and its actual real-time usage. | Charge back to the specific application owner. This incentivizes developers to optimize their CPU/Memory requests. |
Cluster-Level Idle Capacity | Unscheduled nodes or over-provisioned capacity kept warm by cluster autoscalers for rapid scaling. | Socialize this cost across all business units running on the cluster, or treat it as an operational buffer cost paid by the central infrastructure team. |
To illustrate, let us analyze how a FinOps engine handles node-level idle capacity. Suppose we have a worker node costing $100 per month. The node has 10 vCPUs total. Team A's pod requests 4 vCPUs but only uses 1 vCPU on average. Team B's pod requests 4 vCPUs and uses all 4 vCPUs. The remaining 2 vCPUs are unrequested (idle capacity).
If we allocate costs strictly by actual usage, the billing looks like this:
Total usage: 5 vCPUs.
Team A pays: (1 / 5) * $100 = $20
Team B pays: (4 / 5) * $100 = $80
This model is unfair to Team B. Team B optimized their application to consume exactly what they requested. Team A, on the other hand, over-provisioned their requests, tying up cluster resources that could have been used by other workloads, yet they are financially rewarded with a lower bill.
By utilizing a precise cost impact calculation based on resource requests and allocated slack, the allocation engine corrects this distortion. The correct FinOps approach allocates the $100 node cost as follows:
Total requested capacity: 8 vCPUs (80% of node). Total requested cost = $80.
Team A's share of requested cost: (4 / 8) * $80 = $40.
Team B's share of requested cost: (4 / 8) * $80 = $40.
Unrequested node capacity (2 vCPUs): Worth $20. This $20 is "socialized" or split based on the request ratio (50% each), adding $10 to each team's bill.
Final Allocation: Team A pays $50; Team B pays $50.
This model accurately penalizes Team A for their idle requests, providing a clear financial incentive for their engineering team to rightsize their deployments and reduce unnecessary cluster spend.
Reconciling Engineering Metrics with Financial Ledgers
While engineers think in terms of namespaces and pods, corporate finance teams operate strictly in the realm of ledgers, cost centers, and amortization schedules. Bridging this gap requires reconciling the dynamic, real-time metrics of Kubernetes with the rigid monthly accounting cycle.
1. Amortized vs. Unblended Pricing
Cloud providers offer deep discounts via Savings Plans and Reserved Instances (RIs). These discounts are typically applied at the billing account level, often in an unpredictable, non-deterministic fashion across eligible resources. If a Kubernetes node runs on an instance covered by a Savings Plan, its hourly rate in the unblended billing file might drop significantly, while a neighboring node runs at the standard on-demand rate.
For engineering chargeback, using unblended, real-time rates introduces massive volatility into application cost reporting. A service could cost $500 one day and $1,000 the next simply because the cloud provider's billing engine shifted a Savings Plan allocation to a different account. To prevent this, an enterprise financial operations platform must normalize these rates using amortized pricing. This involves calculating a blended, consistent rate for compute resources across the entire organization, ensuring that container cost metrics remain predictable and actionable for development teams.
2. Handling Multi-Cloud and Hybrid Clusters
Modern enterprises rarely run on a single cloud. A single business application might span AWS EKS, Azure AKS, and on-premises bare-metal Kubernetes clusters. Reconciling these environments requires normalizing different billing structures into a single schema. On-premises hardware costs (amortized server depreciation, power, cooling, and data center space) must be translated into an equivalent "hourly node cost" so they can be processed by the exact same allocation formulas used for public cloud resources. This is a core component of comprehensive CIO and FinOps leadership solutions, enabling executives to compare the true unit economics of workloads regardless of where they are deployed.
Architectural Code Example: Parsing Billing Data with PromQL
To give cloud architects an actionable starting point, let us look at a practical technical implementation. The following PromQL query can be used in Prometheus to calculate the hourly cost of memory requests for a specific namespace, mapping raw byte allocations to a normalized daily cost metric. This query assumes that you have populated a custom metric, node_hourly_cost, which maps the underlying VM instance type to its amortized hourly billing rate.
# Calculate the hourly memory cost of pods in the 'payment-gateway' namespace
sum(
  # Step 1: Get the memory requests of the containers in bytes
  kube_pod_container_resource_requests{namespace="payment-gateway", resource="memory"}
) by (node)
* on(node) group_left()
# Step 2: Multiply by the node's memory cost factor
(
  # We divide the node's hourly cost by its total allocatable memory to get cost-per-byte-hour
  label_replace(node_hourly_cost, "node", "$1", "instance", "(.*)")
  /
  sum(kube_node_status_allocatable{resource="memory"}) by (node)
)
This query dynamically joins container-level memory requests with node-level billing telemetry. By running this pipeline at scale, FinOps platforms can continuously calculate the precise financial footprint of ephemeral workloads, feeding accurate data directly into corporate billing systems.
Unifying FinOps, Security, and Operations
True cloud maturity cannot be achieved in a silo. When organizations attempt to solve cost allocation in isolation, they often run into operational bottlenecks. For example, an engineering team might aggressively rightsize their container CPU requests to save money, only to trigger application performance degradation or automated scaling failures during a traffic spike. Similarly, security patches and vulnerability remediation often require rolling out new base images that change the resource footprint of workloads, impacting both performance and cost.
For this reason, forward-thinking enterprises are moving away from disconnected point solutions and adopting integrated platforms. By combining container cost tracking, automated infrastructure rightsizing, patch governance, and vulnerability management into a single control plane, organizations can balance efficiency, security, and performance. This holistic approach ensures that cost-saving recommendations do not compromise the security posture or reliability of critical production applications.
Take Control of Your Cloud Economics with CloudAtler
Navigating the complexities of container cost allocation, dynamic resource tagging, and multi-cloud financial reconciliation is a monumental task for any enterprise. Manual spreadsheets, home-grown scripts, and disconnected cloud-native tools are no longer sufficient to manage the scale of modern Kubernetes environments.
CloudAtler solves this challenge by delivering an AI-powered, unified platform that seamlessly bridges the gap between engineering metrics and corporate finance ledgers. With CloudAtler, you gain real-time visibility into your container spend, automated resource tagging, and precise cost impact calculations across AWS, Azure, GCP, and Oracle Cloud environments. Our platform doesn't just show you where your money is going—it empowers your engineering and finance teams to collaborate, automate operations, and optimize workloads without sacrificing performance or security.
Ready to transform your cloud financial operations? Explore the CloudAtler Platform today or schedule a demo to see how we can help you achieve total visibility and control over your multi-cloud estate.
All in One Place
Atler Pilot decodes your cloud spend story by bringing monitoring, automation, and intelligent insights together for faster and better cloud operations.