
Why Most FinOps Programs Plateau at Dashboards
Every FinOps program begins with enthusiasm. Someone builds a dashboard. The dashboard reveals horrifying numbers. Leadership asks pointed questions. A task force forms. Quick wins — deleting idle resources, purchasing a handful of Reserved Instances — deliver impressive percentage savings in the first quarter. Then progress stalls. The dashboard still exists. People still glance at it. But the organizational muscle that converts visibility into continuous action atrophies because nobody built the habits and processes that sustain it.
This pattern repeats across industries and company sizes because most teams confuse FinOps tooling with FinOps practice. A tool shows you the numbers. A practice changes what you do with them. The best practices in this guide focus on operational habits, organizational structures, and automation patterns that keep FinOps programs producing measurable results quarter after quarter — not just during the initial honeymoon period when everything looks like low-hanging fruit.
If you are starting from scratch, the Practitioner's FinOps Guide for 2026 covers the foundational framework. This article assumes you understand the Inform-Optimize-Operate cycle and focuses on the specific practices that separate programs stuck in Crawl stage from those operating at Run.
Organizational Alignment: The Practice That Unlocks Everything Else
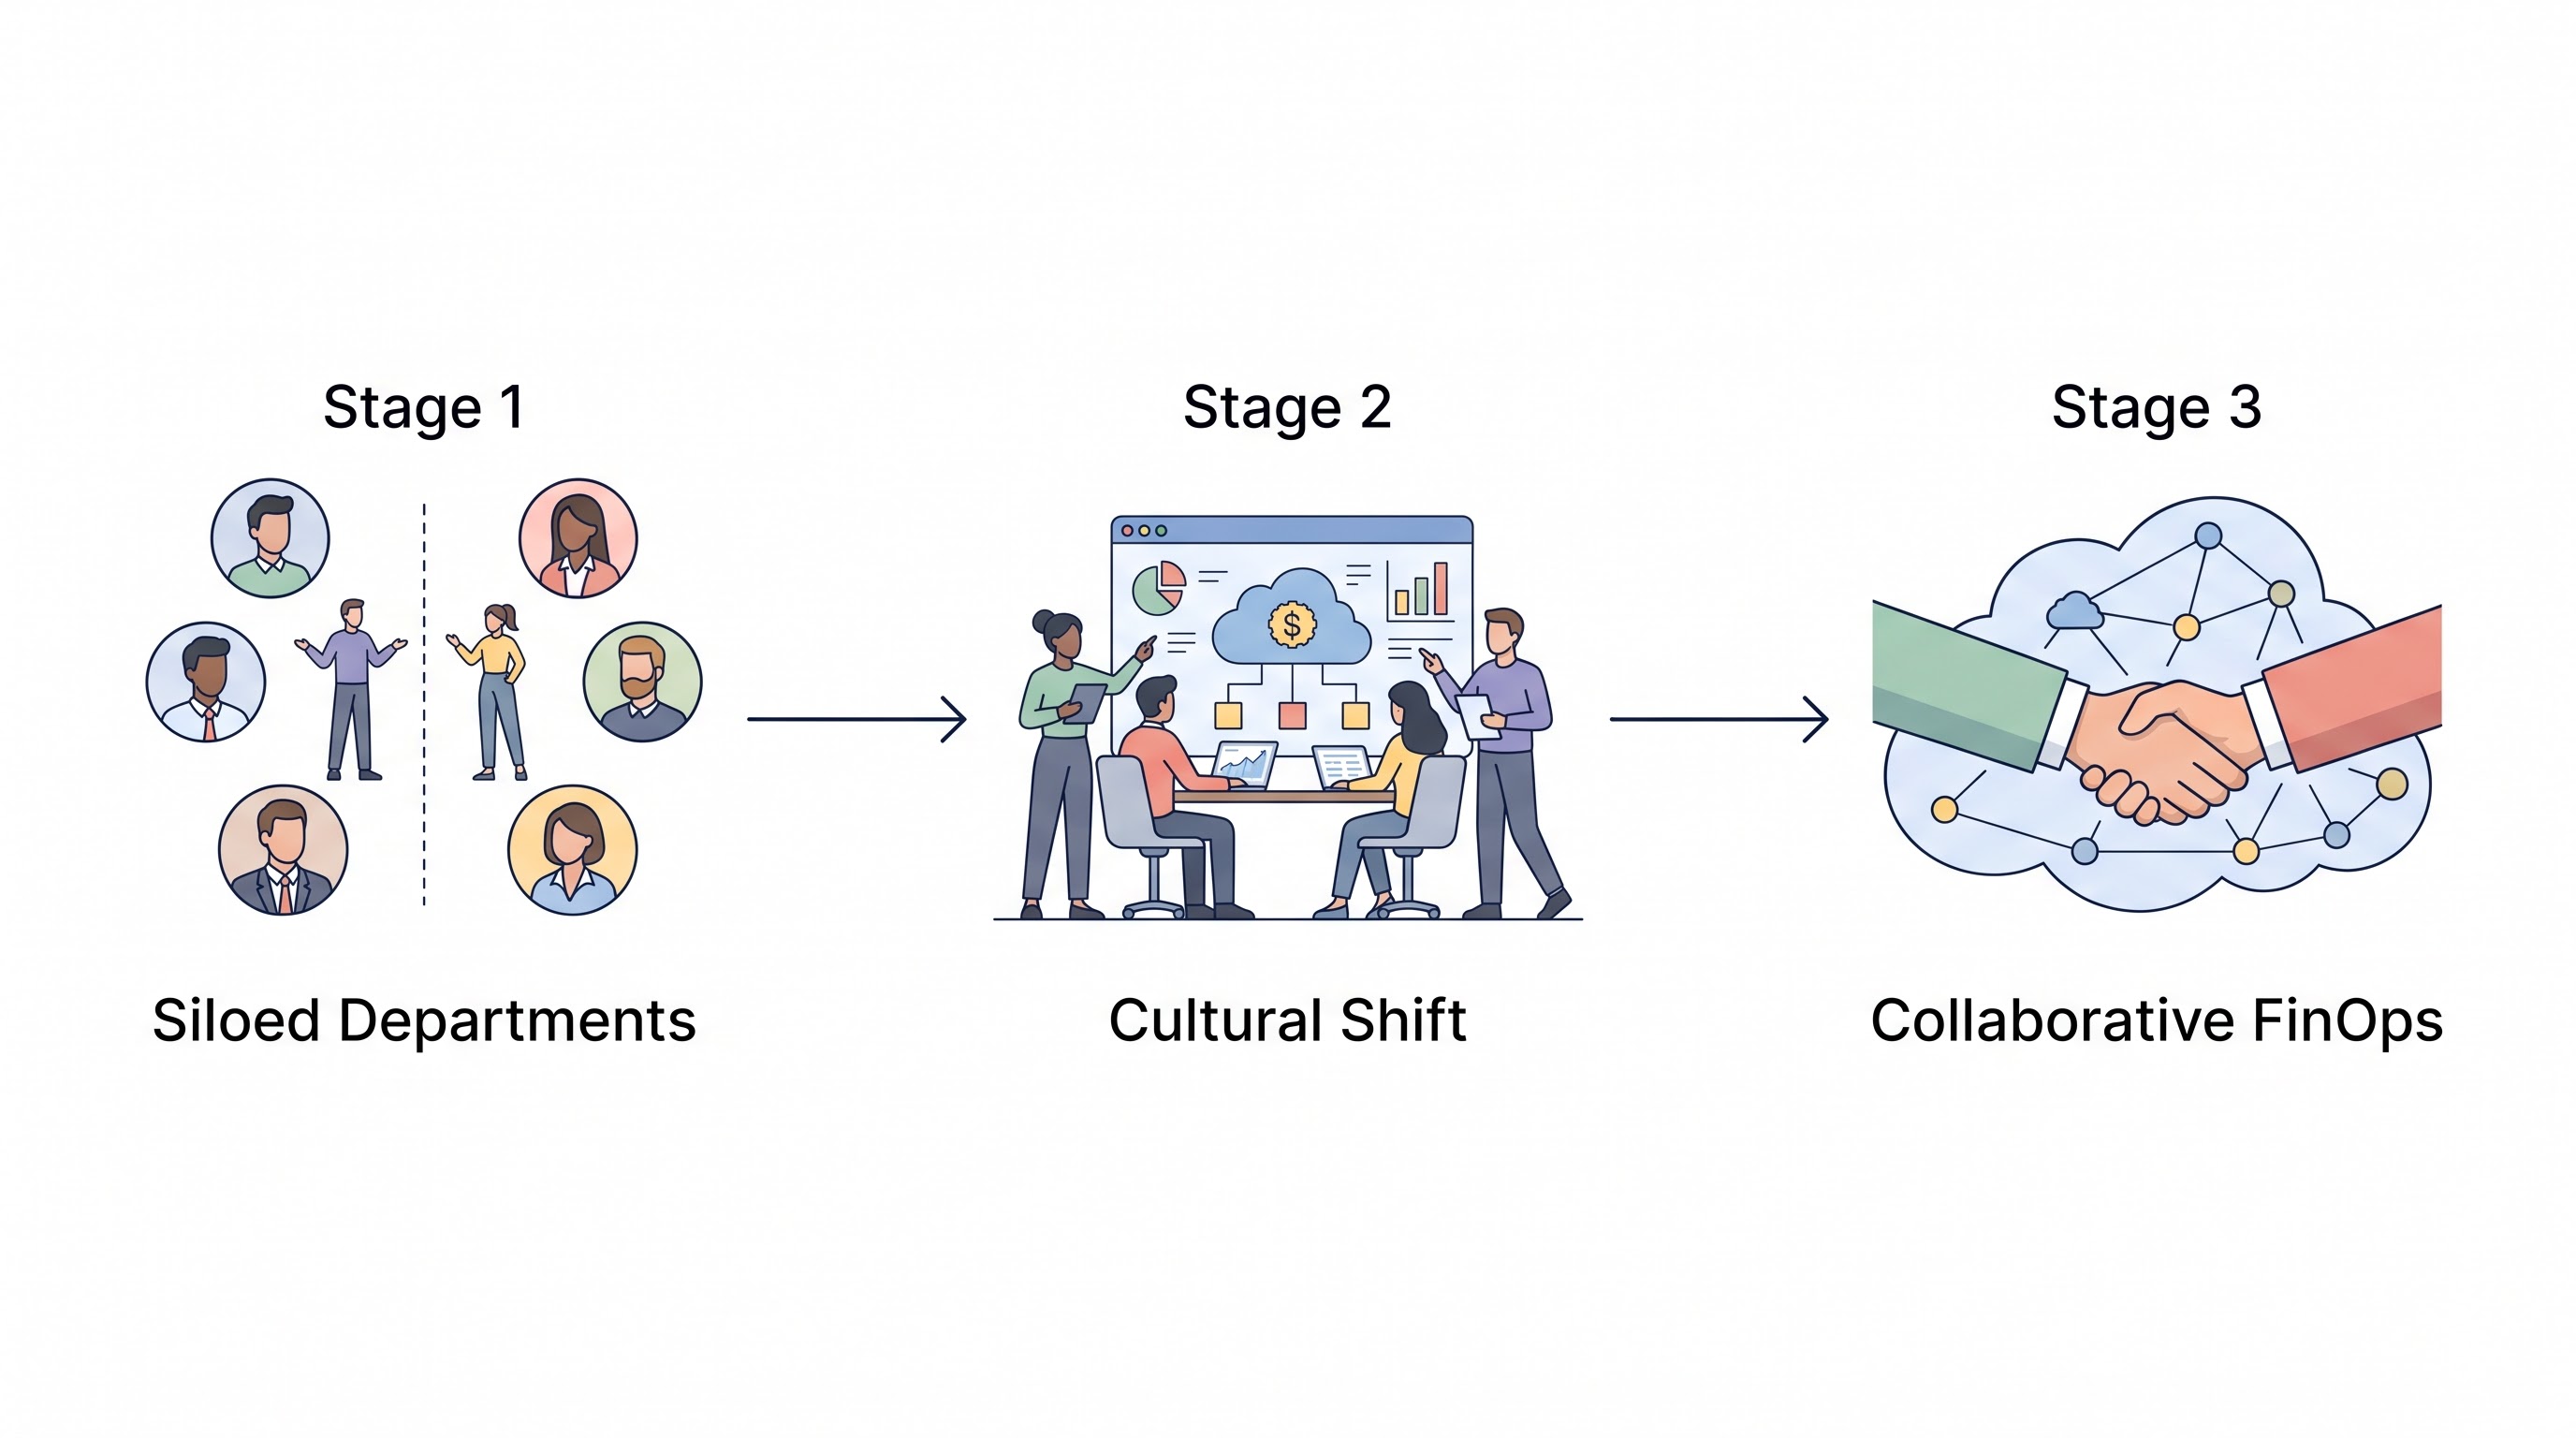
FinOps fails when it operates as an isolated function bolted onto the engineering organization. It succeeds when finance, engineering, and business leadership share a common language around cloud spend and agree on who owns what. That agreement is harder to reach than it sounds because each group enters the conversation with different priorities and different definitions of success.
Finance wants predictable budgets. Engineering wants freedom to provision resources without procurement bottlenecks. Product wants features shipped on schedule regardless of infrastructure cost. The FinOps practice sits at the intersection of these competing interests and must translate between them constantly.
Effective alignment requires three concrete structures:
A FinOps steering committee that meets monthly with representation from engineering leadership, finance, and at least one product or business unit leader. This committee reviews spend trends, approves commitment purchases above a defined threshold, and resolves disputes about cost allocation. Without this governance body, decisions default to whoever shouts loudest or has the most political capital.
Shared cost dashboards with identical data visible to all stakeholders. When finance sees one number and engineering sees a different number because they pull from different sources or apply different allocation models, trust erodes immediately. A unified financial command center eliminates the "your numbers don't match our numbers" argument that derails more FinOps meetings than any technical challenge.
Documented cost ownership at the team level. Every cloud resource belongs to a team. Every team knows their budget. Every team can see their actual spend against that budget in real time. This is the foundation of chargeback and showback models and it must be enforced through mandatory tagging, not suggested through optional guidelines.
Organizations that skip alignment and jump directly to optimization tooling consistently report the same outcome: impressive savings identified on paper, minimal savings realized in practice. The optimization recommendations exist. Nobody acts on them because nobody owns the outcome.
Tagging Enforcement That Sticks
Cloud resource tagging is the unglamorous foundation that every subsequent FinOps capability depends on. Cost allocation requires tags. Showback requires tags. Anomaly detection at the team level requires tags. Rightsizing recommendations directed to the right owner require tags. Without consistent, enforced tagging, your FinOps program runs blind regardless of how sophisticated your tooling stack is.
The challenge is not defining a tagging taxonomy. Any competent team can produce a spreadsheet listing required tags: team, environment, project, cost-center, application. The challenge is making those tags actually appear on every resource deployed across every cloud account, by every engineer, through every provisioning method — Terraform, CloudFormation, console clicks, CLI commands, and automated pipelines.
Practices that achieve high tagging compliance share these characteristics:
Preventive enforcement over detective cleanup. Block resource creation when required tags are missing rather than chasing untagged resources after the fact. AWS Service Control Policies can deny
ec2:RunInstanceswhen theteamtag is absent. Azure Policy can deny resource creation in any resource group lacking mandatory tags. GCP Organization Policies combined with guardrail automation achieve the same effect. Prevention is always cheaper than remediation.Infrastructure-as-code templates with tags baked in. If your Terraform modules include default tag blocks that inherit from a centralized variable file, engineers get correct tagging for free without thinking about it. The IaC guide covers module patterns that enforce tagging automatically at the template level.
Automated tag inheritance for child resources. When an engineer creates an Auto Scaling Group with proper tags but the launched instances do not inherit those tags, your tag coverage percentage drops silently. Configure tag propagation on launch templates, ASGs, and equivalent constructs on Azure and GCP.
Weekly tagging compliance reports sent to team leads. Not buried in a dashboard. Sent directly via Slack or email with specific resource IDs that need attention. Social accountability — "your team dropped from 94% to 87% compliance this week" — drives behavior more effectively than policy documents nobody reads.
Target 95% tagging coverage as the minimum viable threshold. Below that level, your cost allocation data contains enough gaps to undermine confidence in any showback or chargeback reports built on top of it. Use automated tagging tools to close the gap between where you are and where you need to be.
Commitment Management as a Continuous Discipline
Commitment-based pricing — Reserved Instances on AWS, Reserved VM Instances on Azure, Committed Use Discounts on GCP, and Savings Plans across AWS compute — delivers the single largest cost reduction available on cloud platforms. Discounts range from 30% for one-year no-upfront commitments to 72% for three-year all-upfront reservations on specific instance families. Yet many organizations leave this money on the table because commitment purchasing feels risky and the analysis required to do it well seems overwhelming.
The best practice is treating commitment management as a continuous operational process rather than a periodic purchasing event. This means:
Monthly commitment coverage reviews. Measure what percentage of your eligible compute spend is covered by commitments. Industry benchmarks suggest mature FinOps organizations cover 70% to 85% of steady-state compute with commitments. If your coverage sits below 50%, you are overpaying substantially.
Utilization monitoring for existing commitments. A Reserved Instance with 40% utilization is often worse than no reservation at all — you committed capital for capacity you are not using. Track utilization weekly and investigate any commitment dropping below 80%. Commitment intelligence platforms automate this monitoring and flag underperforming reservations before they waste a full billing cycle.
Layered commitment strategy. Cover your baseline compute with 3-year commitments for maximum discount. Cover your predictable-but-evolving workloads with 1-year Savings Plans for flexibility. Leave genuinely variable capacity on-demand or use spot instances for fault-tolerant workloads. This layering approach optimizes across the risk-discount spectrum.
Expiration tracking with 90-day advance notice. When a 1-year RI expires without renewal, the covered instances revert to on-demand pricing instantly. That pricing increase can add $10,000 to $50,000 per month for a single expired batch of reservations at enterprise scale. Set calendar alerts — or better, automated alerts — 90 days before any commitment expires.
The detailed mechanics of each commitment type across providers are covered in the Reserved Instances and Savings Plans guide. The practice-level takeaway is this: treat commitments as financial instruments that require active management, not as one-time purchase decisions you set and forget.
Automation That Compounds Savings
Manual FinOps scales to approximately $2 million in monthly cloud spend before the human effort required to maintain optimization cadence outpaces available hours. Beyond that threshold, automation is not a luxury — it is a survival mechanism. The types of automation that deliver the highest return fall into three categories.
Scheduled Resource Management
Development and staging environments rarely need to run 24/7. A dev environment running from 8 AM to 8 PM on weekdays instead of continuously saves roughly 65% of its compute cost with zero impact on developer productivity. Implement start/stop schedules using AWS Instance Scheduler, Azure Automation runbooks, or GCP Cloud Scheduler with custom Cloud Functions. Tag environments with a schedule tag that defines their operating hours, and let the automation handle the rest.
Automated Rightsizing Recommendations
Rightsizing analysis is only valuable if someone acts on the recommendations. The lag between identifying an oversized instance and actually resizing it stretches to weeks or months in most organizations because the recommendation sits in a queue waiting for an engineer to prioritize it. Automated rightsizing pipelines — where the system identifies candidates, validates them against safety criteria, and executes the resize during a maintenance window with automated rollback capability — eliminate that lag entirely. CloudAtler's compute lifecycle analysis supports this pattern with configurable approval workflows for teams that want human review before execution.
Anomaly Detection and Response
A cost anomaly caught within hours costs tens of dollars to resolve. The same anomaly discovered during monthly invoice review costs thousands. Automated anomaly detection should fire alerts when daily spend deviates more than a configurable percentage from the rolling 7-day average, when a new service appears in the bill for the first time, or when a specific team's spend jumps more than 25% day-over-day. Connect these alerts to Slack channels, PagerDuty, or ServiceNow for immediate visibility.
The compounding effect of automation is significant. Each automated process removes a manual step that would otherwise be forgotten, delayed, or executed inconsistently. Over 12 months, organizations with comprehensive FinOps automation report 2x to 3x the realized savings compared to organizations relying on manual processes with identical tooling.
Culture: Making Engineers Care About Cost
Technical practices and automation only work if the people deploying infrastructure care about cost outcomes. Building that cultural muscle is the hardest part of FinOps and the part most frequently neglected in favor of buying another tool.
Engineers are not inherently indifferent to cost. They are rationally indifferent when cost has no bearing on their performance reviews, their team metrics, or their daily decision-making context. Change the incentive structure and behavior follows:
Include cloud cost efficiency in engineering team OKRs. Not as the primary metric — that would create perverse incentives to underprovisioning — but as a supporting metric alongside availability and performance. "Maintain cloud unit cost per transaction below $0.003" is a meaningful, measurable objective that keeps cost visible without making it the sole priority.
Publish team-level cost leaderboards. Transparency creates healthy competition. When Team A sees that Team B serves similar traffic at 30% lower infrastructure cost, curiosity drives investigation. The leaderboard should normalize by workload — absolute dollar comparisons between a data pipeline team and a static website team are meaningless. Use unit economics as the comparison basis.
Celebrate optimization wins publicly. When an engineer identifies and implements a change that saves $50,000 annually, that achievement deserves the same recognition as shipping a user-facing feature. Slack announcements, engineering all-hands shoutouts, and cost-saving highlight reels in quarterly reviews all reinforce the behavior.
Provide cost data at the point of decision. Engineers make infrastructure choices in Terraform files, CI/CD pipelines, and architecture review documents. Embedding cost estimates directly into those workflows — using tools like Infracost for Terraform cost estimation or budget forecasting integrations in deployment pipelines — gives engineers cost context when it matters most, not in a dashboard they check after the fact.
The FinOps team structure guide covers how to position the FinOps function as a coaching and enablement team rather than cost police. That positioning is essential for cultural adoption. Engineers collaborate with enablement functions. They route around policing functions.
Metrics That Prove FinOps Is Working
Choosing the right metrics determines whether your FinOps program can demonstrate value to leadership or gets defunded after the initial savings wave plateaus. Avoid vanity metrics — total cloud spend declining means nothing if the business is also shrinking. Focus on efficiency metrics that normalize spend against business output.
Metric | What It Measures | Target Range |
|---|---|---|
Cloud cost per revenue dollar | Infrastructure efficiency relative to business output | Declining quarter over quarter |
Commitment coverage rate | Percentage of eligible compute covered by RIs/SPs/CUDs | 70%–85% |
Commitment utilization rate | How fully existing commitments are used | >90% |
Tag compliance rate | Percentage of resources with all mandatory tags | >95% |
Optimization action rate | Percentage of recommendations acted on within 30 days | >60% |
Anomaly detection MTTR | Time from anomaly occurrence to resolution | <24 hours |
Waste percentage | Idle + oversized resources as % of total spend | <10% |
Report these metrics monthly to the FinOps steering committee and quarterly to executive leadership. Trend lines matter more than absolute values — a waste percentage declining from 28% to 12% over four quarters tells a compelling story even if the absolute dollar spend increased due to business growth.
The FinOps ROI analysis guide provides detailed models for translating these operational metrics into financial impact language that resonates with CFOs and board-level stakeholders.
Pitfalls That Derail Even Good Programs
After working with organizations across maturity stages, certain failure patterns appear with predictable regularity. Recognizing them early prevents months of stalled progress.
Over-Optimizing Before You Have Visibility
Teams that jump to purchasing Reserved Instances before establishing reliable cost allocation often buy commitments for the wrong instance families, in the wrong regions, or in quantities that exceed actual steady-state demand. The Inform phase exists for a reason. Spend at least 60 days building accurate visibility before making financial commitments that lock you in for one to three years.
Centralizing All Optimization Decisions
A centralized FinOps team that approves every rightsizing change and every commitment purchase creates a bottleneck that slows optimization to a crawl. The FinOps team should set policy, provide tooling, and coach teams. Execution should be distributed. Engineering teams should be empowered to rightsize their own instances within policy guardrails. Only large commitment purchases — above a threshold you define, typically $50,000 annual commitment value — should require central approval.
Ignoring Networking Costs
Compute and storage dominate most cloud bills, so they dominate most optimization programs. But networking costs — NAT Gateway data processing, cross-region data transfer, VPN tunnel charges, load balancer idle hours — routinely represent 15% to 25% of total spend and grow disproportionately as architectures become more distributed. Include networking in your optimization scope from the start rather than discovering it as a surprise after you have squeezed compute savings to diminishing returns.
Treating FinOps as a Project Instead of a Practice
Projects have end dates. FinOps does not. Cloud waste regenerates continuously as teams deploy new infrastructure, traffic patterns shift, and pricing models change. The organizations that sustain long-term savings embed FinOps into their operating rhythm — daily anomaly checks, weekly idle resource sweeps, monthly commitment reviews, quarterly architecture assessments. Those that treat FinOps as a one-time initiative see waste percentages revert to pre-optimization levels within 6 to 9 months.
Mapping Practices to Maturity Stages
Not every best practice applies at every maturity stage. Attempting Run-stage automation when you have not completed Crawl-stage visibility is a recipe for expensive mistakes. Here is a practical mapping of which practices to prioritize at each stage of the FinOps maturity model:
Crawl Stage (Months 0–6)
Establish mandatory tagging policy with at least
team,environment, andcost-centertagsDeploy basic cost dashboards showing spend by team and by service
Implement anomaly alerting at the account level
Run first idle resource cleanup sprint
Purchase initial Reserved Instances for clearly stable production workloads only
Form the FinOps steering committee
Walk Stage (Months 6–18)
Enforce tagging via policy-as-code (SCPs, Azure Policy, OPA)
Implement showback or chargeback at the team level
Build quarterly rightsizing review cadence
Expand commitment coverage to 60%+ of eligible compute
Automate dev/staging environment scheduling
Publish team-level cost metrics in engineering dashboards
Deploy a FinOps automation platform for multi-cloud visibility
Run Stage (18+ Months)
Automated rightsizing with configurable approval workflows
Continuous commitment optimization with utilization monitoring
Unit economics tied to business KPIs and reported quarterly
Cost estimation embedded in CI/CD pipelines
Engineering OKRs include cost efficiency metrics
Predictive budget forecasting using ML-driven models via CloudAtler's forecasting engine
Progress through these stages iteratively. Each capability area — tagging, commitments, rightsizing, automation — may be at a different stage simultaneously, and that is perfectly normal. The goal is continuous forward movement across all areas, not perfection in any single dimension before advancing the others.
Key Takeaway
FinOps best practices in 2026 center on organizational alignment, tagging enforcement, continuous commitment management, compounding automation, and cultural integration. The programs that deliver sustained savings treat FinOps as an operational discipline woven into engineering culture — not a project with an end date or a dashboard someone checks monthly. Start with the practices that match your current maturity stage, measure progress with efficiency metrics rather than absolute spend, and build toward automation that removes human bottlenecks from the optimization cycle.
All in One Place
Atler Pilot decodes your cloud spend story by bringing monitoring, automation, and intelligent insights together for faster and better cloud operations.