
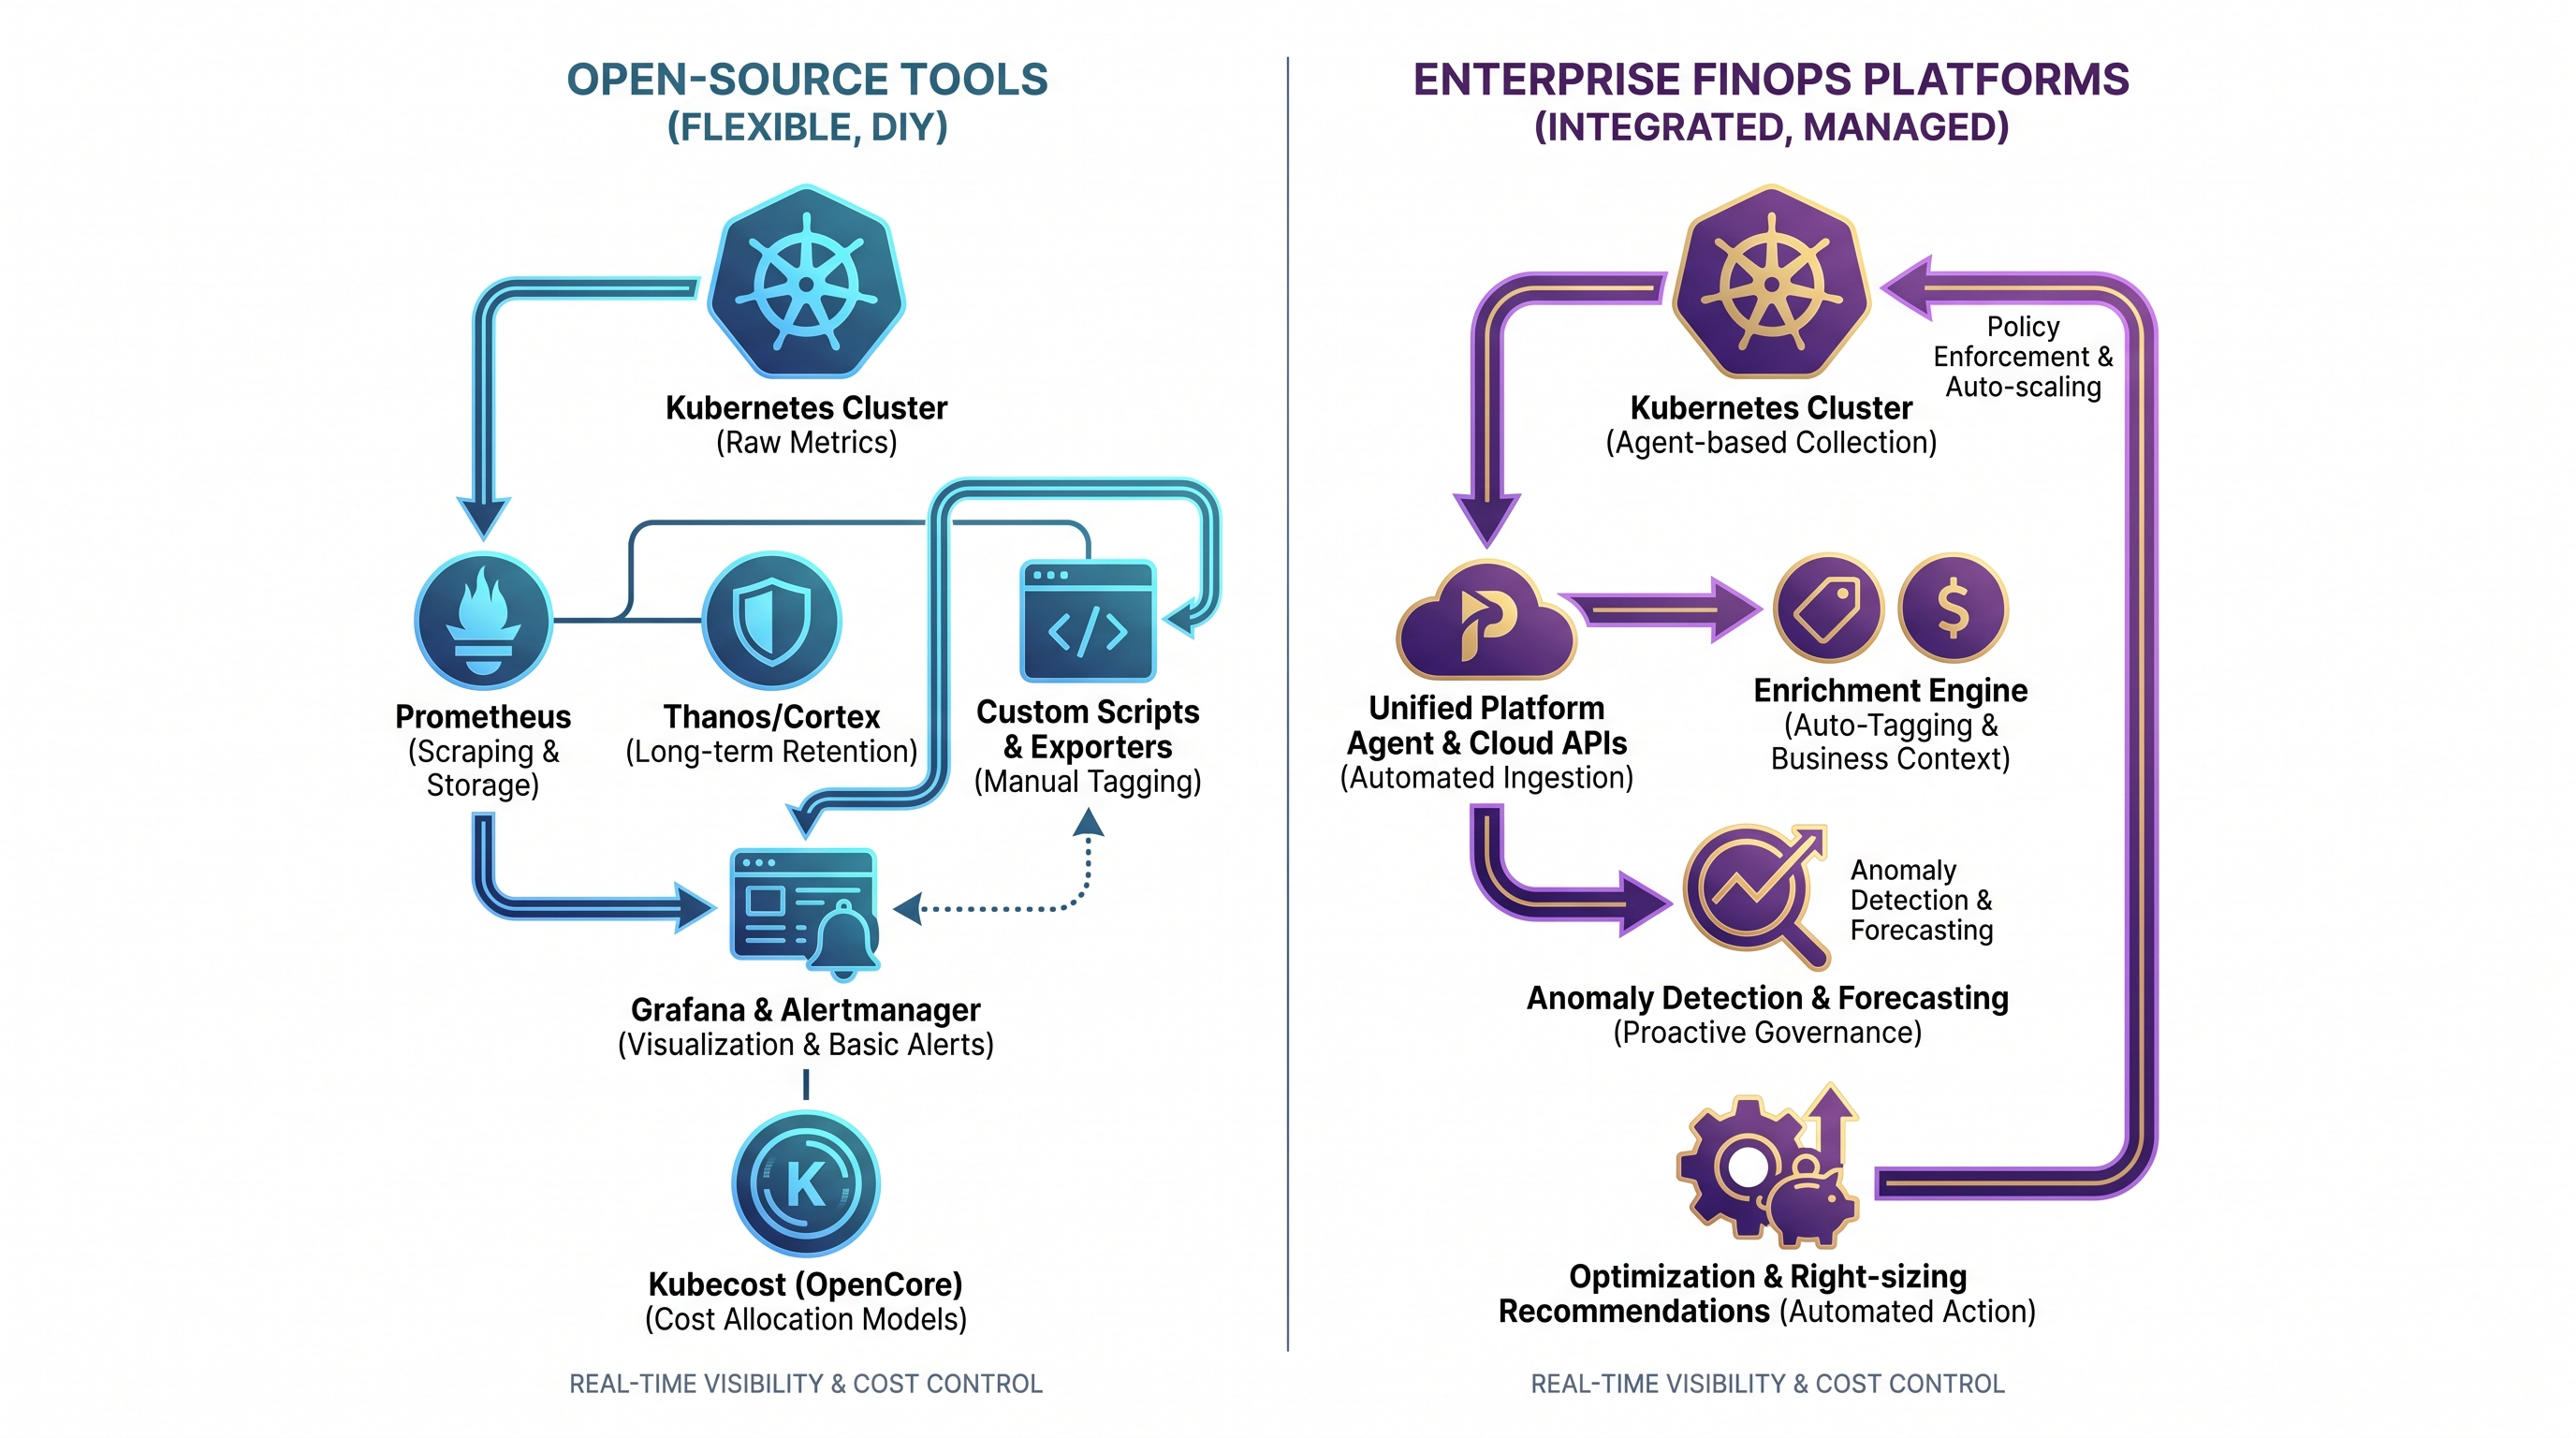
The Kubernetes Cost Conundrum: Why Traditional Cloud Billing Fails
In traditional cloud environments, cost allocation is relatively straightforward. Virtual machines (VMs) are provisioned with static resource allocations, mapped to specific cost centers via cloud tags, and billed on a predictable hourly or per-second basis. Cloud Financial Management (FinOps) teams can easily trace a specific AWS EC2 instance, Azure VM, or Google Compute Engine instance back to the application team that provisioned it.
Kubernetes completely shatters this paradigm. It acts as a massive abstraction layer over raw infrastructure, pooling compute, memory, and storage resources across a cluster of nodes and dynamically scheduling ephemeral workloads (Pods) across them. A single underlying VM (node) might run dozens of containers belonging to completely different microservices, departments, or environments (e.g., staging, production, testing) simultaneously.
Traditional cloud billing exports, such as the AWS Cost and Usage Report (CUR) or GCP Detailed Billing Export, only show the cost of the underlying virtual machines. They have zero visibility into the internal scheduling of the Kubernetes control plane. If a cluster of ten nodes costs $5,000 per month, the cloud provider’s bill cannot tell you how much of that spend was consumed by your payment processing service versus your background batch-processing workers. This lack of granularity leads to several critical challenges:
Shared Resource Allocation: How do you equitably distribute the cost of shared cluster utilities, such as ingress controllers (e.g., NGINX, Traefik), logging agents (e.g., Fluentd), service meshes (e.g., Istio), and the Kubernetes control plane itself?
Ephemeral Workloads: Pods can spin up, execute a task, and terminate within seconds. Capturing their resource consumption in real-time requires high-frequency metrics scraping that traditional billing cycles (which update every few hours) cannot support.
The "Request vs. Usage" Gap: Kubernetes schedules pods based on developer-defined resource "requests," but actual "usage" may be far lower. Who pays for the idle, over-provisioned capacity—the application team or the central platform team?
Multi-Tenant Overhead: Without granular namespace, label, and pod-level cost allocation, accurate showback and chargeback models are impossible to implement, leading to organizational friction and untracked cloud spend.
The Architecture of Real-Time Kubernetes Cost Allocation
To accurately compute the cost of a Kubernetes workload in real-time, a cost engine must synthesize data from two distinct sources: the Kubernetes API/metrics server and the cloud provider's pricing APIs. The architecture typically relies on several key components working in tandem:
+-----------------------------------------------------------------------+
|                         Kubernetes Cluster                            |
|                                                                       |
|   +------------------+     +--------------------+                     |
|   |   cAdvisor /     |     |  kube-state-metric |                     |
|   |  Kubelet Metrics |     |                    |                     |
|   +--------+---------+     +---------+----------+                     |
|            |                         |                                |
|            | (CPU/Mem Usage)         | (Requests/Limits/Labels)       |
|            v                         v                                |
|   +---------------------------------------------+                     |
|   |            Prometheus TSDB                  |                     |
|   +----------------------+----------------------+                     |
|                          |                                            |
|                          | (Scraped Metrics)                          |
|                          v                                            |
|   +---------------------------------------------+    +------------+   |
|   |            Cost Allocation Engine           |<---| Cloud APIs |   |
|   |         (OpenCost / FinOps Platform)        |    | (On-Demand |   |
|   +----------------------+----------------------+    | Spot, RI)  |   |
|                          |                           +------------+   |
+--------------------------|--------------------------------------------+
                           v
              +--------------------------+
              | Real-Time Cost Dashboard |
              +--------------------------+
1. Resource Metric Collection
First, the cost engine must monitor the physical resources consumed by containers. cAdvisor (Container Advisor), which is embedded directly into the Kubelet on each node, collects CPU, memory, network, and disk usage metrics. Simultaneously, kube-state-metrics listens to the Kubernetes API server to gather state information, including pod resource requests, resource limits, namespace allocations, and active replica sets.
2. The Cost Calculation Formula
Once resource metrics are captured, the engine calculates the cost of a specific container using a standardized allocation formula. The primary decision point is whether to charge based on Resource Requests (what the container reserved) or Resource Usage (what the container actually consumed). Most robust models use a hybrid approach:
CostContainer = max(Request, Usage) × RateResource
Where:
Request: The minimum amount of CPU/Memory guaranteed to the container by the scheduler. Even if the container uses 0% CPU, this capacity is blocked and cannot be used by other non-burstable workloads; thus, it must be paid for.
Usage: If the container bursts above its request (up to its limit), it consumes active cluster resources, which are billed based on the actual usage duration.
RateResource: The hourly cost of a unit of CPU (vCPU-hour) or memory (GB-hour), derived from the underlying node's cost.
3. Dynamic Cloud Pricing Integration
To translate raw resource metrics into monetary values, the cost engine must know the exact pricing of the underlying virtual machines. This requires real-time integration with cloud provider billing APIs (such as the AWS Price List API, Azure Retail Prices API, or GCP Cloud Billing Catalog API). The engine must dynamically detect:
Whether the underlying node is running on an On-Demand, Spot/Preemptible, or Reserved/Savings Plan billing model.
Regional pricing variations and custom enterprise discount programs (EDPs).
Storage class pricing for Persistent Volumes (PVs) attached to workloads.
Open-Source Cost Monitoring: OpenCost and Kubecost Community Edition
For engineering teams looking to establish immediate visibility into their Kubernetes clusters without commercial licensing friction, open-source solutions are the standard starting point. The most prominent player in this space is OpenCost, an open-source, CNCF Sandbox project that defines a specification and implementation for real-time Kubernetes cost allocation.
Architectural Deep Dive into OpenCost
OpenCost runs as a lightweight daemon within the Kubernetes cluster. It integrates directly with Prometheus to query metrics and exposes a standardized REST API for cost queries. Below is an example of how OpenCost calculates and exposes cost metrics via Prometheus queries:
# Prometheus query to calculate CPU cost per namespace over the last 24 hours
sum(
  rate(node_cpu_hourly_cost[24h])
  *
  on(node) group_left() kube_pod_container_resource_requests{resource="cpu"}
) by (namespace)
Deploying OpenCost typically involves configuring a Helm chart that installs the OpenCost agent, sets up Prometheus scraping rules, and configures read-only access to your cloud provider's pricing APIs. While highly effective for a single cluster, open-source architectures introduce significant operational and engineering overhead as environments scale.
The Technical Gaps of Open-Source Implementations
While open-source tools provide excellent baseline metrics, they present several architectural and operational limitations when deployed in large-scale enterprise environments:
The TSDB Scaling Bottleneck: Open-source cost monitoring relies heavily on Prometheus as its Time Series Database (TSDB). As your clusters grow to thousands of pods and millions of ephemeral metric series, Prometheus experiences high memory consumption and query latency. To maintain historical cost data for compliance and trend analysis, teams must build and maintain complex auxiliary infrastructure such as Thanos or Cortex for long-term metric storage.
Multi-Cluster and Multi-Cloud Complexity: OpenCost operates primarily at the individual cluster level. Aggregating costs across fifty different clusters spanning AWS (EKS), Azure (AKS), and GCP (GKE) requires building custom data pipelines, ETL processes, and centralized data warehouses to merge disparate Prometheus metrics into a single pane of glass.
Lack of Write-Back and Automation: Open-source tools are strictly observational. They tell you that a namespace is over-provisioned, but they cannot execute automated scaling actions, adjust horizontal pod autoscalers (HPAs), or terminate idle resources safely without manual intervention from SRE teams.
Disconnected Cloud Context: Kubernetes is rarely a standalone island. Most containerized applications rely heavily on external cloud services, such as managed databases (AWS RDS, Azure SQL), object storage (S3, GCS), or message queues (SQS, Pub/Sub). Open-source Kubernetes cost tools struggle to correlate in-cluster container costs with these out-of-cluster cloud resources, leaving a significant blind spot in your total cost of ownership (TCO) calculations.
Enterprise FinOps Platforms: Architecture and Unification
Enterprise FinOps platforms solve the scaling and operational limitations of open-source tools by shifting from simple metric collection to holistic, multi-cloud cost intelligence. Instead of merely reporting resource utilization, an enterprise-grade financial operations platform unifies infrastructure metrics, billing data, application performance, and automated orchestration into a centralized command center.
1. Multi-Cloud Normalization and Billing Ingestion
Unlike open-source tools that scrape local pricing APIs, enterprise platforms ingest raw billing telemetry directly from cloud providers' billing buckets (e.g., AWS CUR, Azure Cost Export) and normalize this data alongside real-time Kubernetes metrics. This allows the platform to perform real-time cost impact calculation, mapping actual, amortized contract rates—including Savings Plans, Enterprise Discount Programs (EDPs), and Reserved Instances—directly down to individual Kubernetes pods and namespaces.
2. Enterprise-Grade Data Architecture
Rather than burdening local cluster Prometheus instances with years of financial data, enterprise platforms offload telemetry to highly scalable, distributed data pipelines. This architecture ensures that metric collection has a near-zero footprint on the production Kubernetes clusters, preventing cost monitoring from consuming the very CPU and memory resources it is meant to optimize.
+-------------------------------------------------------------------------+
|                          Enterprise Architecture                        |
|                                                                         |
|  [ Cluster A ]       [ Cluster B ]       [ Cluster C ]   [ Cloud Bills ]|
|  Lightweight Agent   Lightweight Agent   Lightweight Agent     |        |
|        |                   |                   |               |        |
|        +-------------------+-------------------+               |        |
|                            | (Secure Streaming Telemetry)      |        |
|                            v                                   v        |
|  +-------------------------------------------------------------------+  |
|  |                CloudAtler Unified Ingestion Engine                |  |
|  +---------------------------------+---------------------------------+  |
|                                    |                                    |
|                                    v                                    |
|  +-------------------------------------------------------------------+  |
|  |                 Real-Time Stream Processing &                     |  |
|  |                  Cost Impact Calculation Engine                   |  |
|  +---------------------------------+---------------------------------+  |
|                                    |                                    |
|                                    v                                    |
|  +-------------------------------------------------------------------+  |
|  |       Unified Dashboard, Security Correlation & AI Automation       |  |
|  +-------------------------------------------------------------------+  |
+-------------------------------------------------------------------------+
3. Automated Governance and Closed-Loop Remediation
The true differentiator of an enterprise platform is the transition from visibility to automated action. By correlating Kubernetes utilization metrics with business logic, an enterprise platform can safely execute optimization strategies without compromising application reliability. This includes automated resizing of container resource requests, dynamic node pool scaling, and identifying abandoned workloads based on real-time traffic analysis.
The Security, Operations, and Cost Intersection
Modern cloud architecture cannot treat cost, security, and operations as isolated silos. A change in one domain invariably impacts the others. For instance, when SRE and security teams identify critical vulnerabilities within a cluster, the remediation process (such as rolling out patched node AMIs or upgrading container base images) requires spinning up temporary node groups. This surge capacity temporarily increases compute costs.
Conversely, cost-optimization tactics like aggressive bin-packing—squeezing as many pods as possible onto a minimal number of nodes—can introduce severe operational and security risks:
Resource Starvation: If a node is over-committed, a sudden traffic spike can trigger CPU throttling or Out-of-Memory (OOM) kills of critical security monitoring agents or logging daemons, blinding your security operations center (SOC).
Blast Radius Expansion: Consolidating diverse workloads onto fewer, larger nodes increases the security blast radius. If an attacker compromises a single node, they gain access to a larger pool of co-located container runtimes and service account tokens.
Noisy Neighbor Vulnerabilities: Unrestricted workloads can monopolize shared node resources, leading to localized Denial of Service (DoS) conditions for adjacent pods on the same host.
To mitigate these risks, enterprises must implement an automated tagging framework that dynamically injects cost-center, owner, and security-posture metadata directly into Kubernetes manifests. This ensures that every container, regardless of how briefly it lives, is fully accounted for from both a financial and security compliance perspective.
Furthermore, deploying comprehensive CIO FinOps solutions allows technology leaders to balance these trade-offs. Rather than optimizing blindly for the lowest possible spend, organizations can establish guardrails that maintain necessary redundancy, guarantee resource availability for security agents, and automate vulnerability patching without triggering unexpected cloud budget overruns.
Comparative Matrix: Open-Source vs. Enterprise Platforms
To help cloud architects and financial stakeholders evaluate their options, the following matrix compares the technical capabilities and operational overhead of open-source Kubernetes cost tools against enterprise FinOps platforms:
Feature / Dimension | Open-Source (OpenCost / Kubecost CE) | Enterprise FinOps Platforms (CloudAtler) |
|---|---|---|
Data Ingestion & Scaling | Relies on local Prometheus/TSDB; query performance degrades at scale. | Distributed, off-cluster data pipelines with long-term retention and near-zero cluster footprint. |
Multi-Cloud Aggregation | Requires manual federation (Thanos/Cortex) and custom BI engineering. | Out-of-the-box normalization across AWS, Azure, GCP, and Oracle Cloud. |
Out-of-Cluster Correlation | Limited; struggles to map external databases and storage to specific pods. | Seamless correlation of in-cluster workloads with managed cloud services and raw infrastructure. |
Automation & Remediation | Read-only recommendations; execution requires custom scripting or manual intervention. | Closed-loop, automated scaling, resource resizing, and policy enforcement. |
Security & Operations Alignment | None; cost metrics are isolated from security vulnerabilities and patch cycles. | Deep integration correlating cost optimization with security posture, compliance, and patch management. |
Operational Overhead | High; requires ongoing maintenance of metrics infrastructure and pricing APIs. | Low; managed platform-as-a-service with automated updates and maintenance. |
Strategic Recommendation: When to Choose Which?
The choice between open-source and enterprise cost monitoring is ultimately determined by your organization's cloud maturity, scale, and operational philosophy.
Choose Open-Source If:
You operate a small-to-medium infrastructure footprint with fewer than five Kubernetes clusters.
Your applications are hosted within a single cloud provider and rely minimally on external, managed cloud services.
You have dedicated SRE resources with the bandwidth to build, maintain, and scale Prometheus, Thanos, and custom dashboard integrations.
Your primary goal is baseline visibility rather than automated, multi-cloud cost remediation or security-cost correlation.
Choose an Enterprise FinOps Platform If:
You manage large-scale, multi-tenant, or multi-cluster environments across heterogeneous cloud providers (AWS, Azure, GCP, Oracle).
Your engineering teams are spending valuable sprint cycles maintaining internal monitoring infrastructure rather than delivering product features.
You require precise, audit-ready showback and chargeback calculations that reflect actual enterprise contract discounts and dynamic spot-instance pricing.
You want to leverage machine learning to automate resource optimization safely, without risking application performance or violating security compliance.
You need to break down the silos between FinOps, Security, and Platform Engineering to manage cloud health holistically.
Conclusion: Unify Your Cloud Operations with CloudAtler
As Kubernetes continues to dominate the enterprise application landscape, managing its cost and operational complexity in isolation is no longer viable. Open-source tools provide a valuable starting point for local cluster visibility, but they quickly become operational liabilities when scaled across multi-cloud environments. True cloud efficiency requires a unified approach that treats cost optimization, security posture, and automated operations as interconnected facets of a single system.
CloudAtler bridges this gap by delivering an AI-powered platform that unifies FinOps, cloud security, and automated operations across AWS, Azure, GCP, and Oracle Cloud environments. By leveraging the advanced capabilities of the Atler AI engine, CloudAtler continuously analyzes your container metrics, correlates them with real-time billing data, and executes automated, safe remediation strategies that protect your budget without compromising your security or performance posture.
Stop wasting engineering hours managing complex metrics pipelines and chasing untracked container spend. Elevate your cloud strategy, secure your infrastructure, and gain absolute financial clarity today. Explore the CloudAtler Platform or schedule a personalized demo with our cloud architects to see how we can transform your FinOps operations.
All in One Place
Atler Pilot decodes your cloud spend story by bringing monitoring, automation, and intelligent insights together for faster and better cloud operations.