
The Cost of Fear: Why Kubernetes Clusters Run Cold and Cost Warm
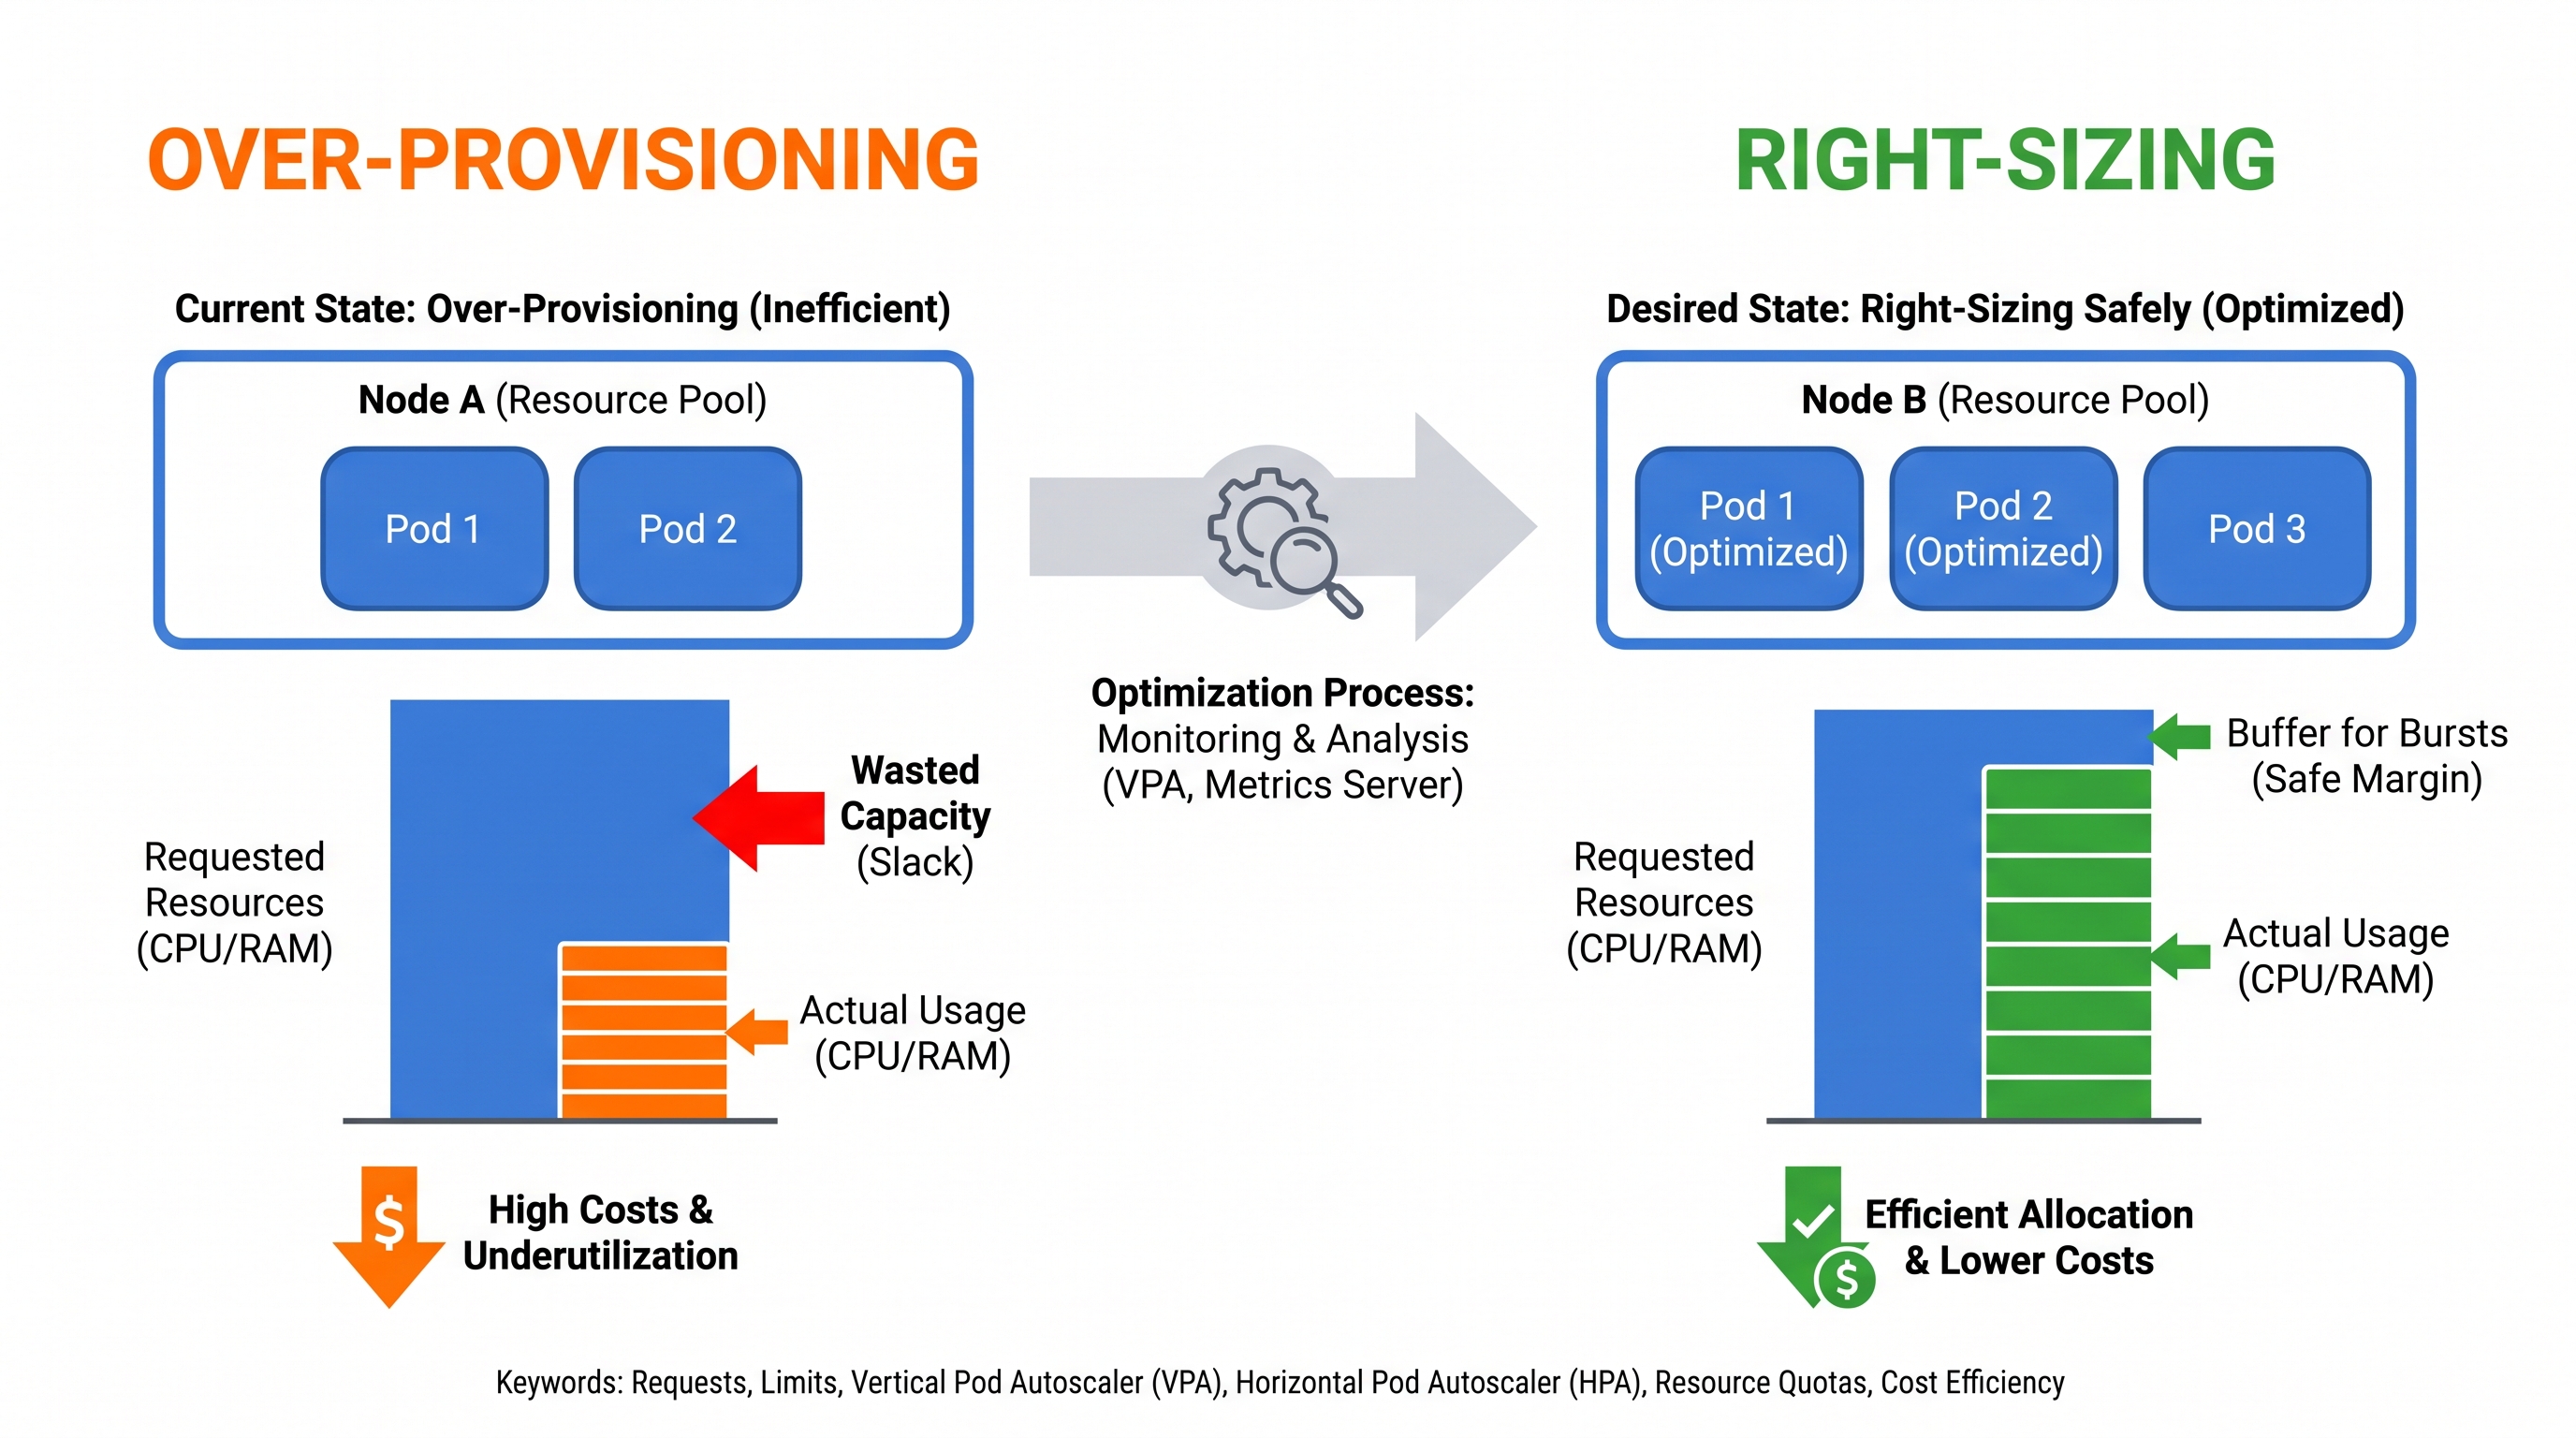
In modern cloud-native architectures, Kubernetes has become the de facto operating system for containerized workloads. However, its declarative nature introduces a significant operational challenge: resource allocation. To guarantee application availability, platform engineers and developers typically configure CPU and memory specifications for every workload. Yet, because the penalty for under-provisioning is highly visible—resulting in slow response times, service outages, or the dreaded Out-Of-Memory (OOM) Kill—engineers naturally default to extreme over-provisioning.
This dynamic leads to a phenomenon known as "slack space"—the gap between allocated resources (what is requested and reserved on the underlying cloud instances) and actual utilization (what the code actually consumes). In enterprise environments across AWS, Azure, GCP, and Oracle Cloud, average CPU utilization frequently hovers between 8% and 15%, while memory utilization rarely exceeds 40%. Despite this low usage, organizations pay for 100% of the underlying virtual machines because the Kubernetes scheduler reserves resources based on requests, not actual usage.
Addressing this inefficiency requires more than just slashing resource values in YAML manifests. It demands an understanding of how the Linux kernel enforces resource boundaries, how the Kubernetes scheduler handles bin-packing, and how to implement continuous optimization. By leveraging a comprehensive FinOps financial operations platform, enterprises can transition from reactive, fear-based provisioning to proactive, safe, and automated resource optimization.
Under the Hood: How Kubernetes Manages CPU and Memory
To right-size workloads safely, we must first understand the distinct mechanics used by the kubelet and the Linux kernel to manage CPU and memory. While both are declared under the resources block of a pod specification, they are handled by completely different kernel subsystems.
CPU: A Compressible Resource
CPU is classified as a compressible resource. If a container exceeds its allocated CPU capacity, the operating system does not terminate the process. Instead, it throttles it. The Kubernetes kubelet uses Linux Control Groups (cgroups)—specifically the Completely Fair Scheduler (CFS) bandwidth control—to enforce CPU limits.
When you define a CPU request, Kubernetes translates this value into CPU shares (where 1000 millicores equals 1024 shares). The scheduler uses these shares to distribute CPU cycles proportionally among competing containers when the node is under heavy load. If a node is idle, a container can easily burst past its request up to its limit.
When you define a CPU limit, Kubernetes configures the CFS quota (cpu.cfs_quota_us) and CFS period (cpu.cfs_period_us, which defaults to 100,000 microseconds or 100ms). For example, if a container has a limit of 0.5 CPU (500m), it is allowed to run for a total of 50,000 microseconds within every 100ms window. Once it exhausts this quota, the kernel throttles the container's threads until the next period begins. This throttling causes severe latency spikes and API timeouts, even if the overall node CPU utilization appears low.
Memory: An Incompressible Resource
Unlike CPU, memory is incompressible. If a container runs out of physical memory, the system cannot throttle it or swap its pages to disk (swap is historically disabled or highly restricted in Kubernetes environments). It must reclaim memory immediately.
Memory requests are used strictly by the kube-scheduler to find a node with sufficient unreserved memory to host the pod. Memory limits are enforced via the memory cgroup (memory.limit_in_bytes).
If a container exceeds its memory limit, the Linux kernel's Out-Of-Memory (OOM) Killer intercepts the process. The kernel evaluates processes based on their oom_score and terminates the offending process with Exit Code 137 (OOMKilled). Because memory limits are strictly enforced, setting them too close to average usage invites instability, while setting them too high leads to node-level memory pressure and cascading pod evictions.
Quality of Service (QoS) Classes and Eviction Priorities
Kubernetes classifies pods into three distinct Quality of Service (QoS) classes based on their resource configurations. This classification directly dictates how the kubelet manages pods during resource starvation:
Guaranteed: Every container in the pod must have both CPU and memory requests and limits explicitly defined, and the request must equal the limit. These pods have the highest priority and are the last to be evicted or terminated during node-level resource crises.
Burstable: At least one container has a request that does not equal its limit. This is the most common configuration, allowing pods to burst when resources are available but making them targets for eviction if the node runs out of memory.
BestEffort: No requests or limits are defined. These pods run on spare capacity. If the node experiences any resource pressure, BestEffort pods are the first to be terminated.
The Financial and Security Risks of Misconfiguration
Misconfigured resource boundaries do not merely impact application performance; they introduce severe financial and security liabilities across the enterprise.
The FinOps Impact: Unallocated vs. Unused Capacity
From a FinOps perspective, waste in Kubernetes manifests in two ways:
Unused Capacity within Pods: Pods requesting 4 vCPUs but only utilizing 0.2 vCPUs on average. This represents direct cloud spend wasted on idle capacity.
Unallocated Node Capacity: When nodes cannot accept new pods because existing pods have reserved all available resource requests, even though those pods are idle. This forces the cluster autoscaler to provision additional, expensive virtual machines unnecessarily.
Without deep performance management capabilities, mapping these raw metrics to financial impact is nearly impossible, resulting in massive, unoptimized cloud bills.
The Security and Stability Impact: Noisy Neighbors and DoS
Failing to set resource boundaries is a critical security vulnerability. If a cluster contains pods without memory or CPU limits (BestEffort QoS), a compromised container, a software bug (such as an infinite loop), or a malicious Denial of Service (DoS) attack can consume 100% of the host node's resources. This starves critical system daemons (like kubelet, containerd, or logging agents), rendering the entire node unresponsive and taking down neighboring tenant applications. Properly configuring limits enforces hard boundaries, ensuring blast containment.
A Data-Driven Guide to Right-Sizing Requests and Limits
Right-sizing is not a guessing game. It requires analyzing historical metric telemetry and applying mathematical models to establish safe boundaries. Let's walk through the exact process for determining optimal CPU and memory configurations.
Step 1: Extracting Telemetry with PromQL
To analyze resource usage, you must query your Prometheus or metrics server. Rather than looking at average utilization (which smooths out critical spikes), you must evaluate the 95th or 99th percentile of usage over a representative window (e.g., 7 to 14 days) to capture peak traffic cycles.
To find the 95th percentile of CPU utilization for a specific container:
histogram_quantile(0.95, sum(rate(container_cpu_usage_seconds_total{container="my-app"}[5m])) by (le, pod))To find the maximum memory utilization over the last 14 days:
max_over_time(container_memory_working_set_bytes{container="my-app"}[14d])Note: Always use container_memory_working_set_bytes rather than container_memory_usage_bytes, as the working set includes active memory that cannot be released under pressure, making it the metric the kernel uses to trigger OOM kills.
Step 2: Calculating Optimal CPU Requests and Limits
For most enterprise workloads, the following mathematical model provides an optimal balance between safety and cost-efficiency:
CPU Request: Set the request equal to the 90th percentile of CPU utilization. This ensures that during normal operating conditions, the pod has guaranteed access to all the CPU cycles it requires, preventing scheduling delays.
CPU Limit: Set the limit to the 99th percentile multiplied by a safety buffer (typically 1.2x to 1.5x), or omit the limit entirely if your cluster has a strong node-level throttling strategy. If you must use limits to prevent runaway processes, ensure they are high enough to accommodate application startup spikes (e.g., JVM warmups), which often require 3-4x more CPU than steady-state execution.
Step 3: Calculating Optimal Memory Requests and Limits
Because memory is incompressible, our buffer strategies must be significantly more conservative:
Memory Request: Set the request to the 95th percentile of the working set size. This ensures the scheduler places the pod on a node that can comfortably host its typical footprint.
Memory Limit: Set the limit to 1.2x to 1.3x of the maximum observed memory utilization (peak usage). For memory-intensive applications or those prone to sudden memory spikes (like data processing engines), increase this buffer to 1.5x. This buffer provides an essential cushion against unexpected traffic surges or minor memory leaks.
Example: Optimized Kubernetes Deployment Manifest
Below is a production-ready manifest demonstrating how to apply these calculated values to a standard microservice deployment:
apiVersion: apps/v1
kind: Deployment
metadata:
  name: payment-gateway
  namespace: production
  labels:
    app: payment-gateway
spec:
  replicas: 3
  selector:
    matchLabels:
      app: payment-gateway
  template:
    metadata:
      labels:
        app: payment-gateway
    spec:
      containers:
      - name: gateway-service
        image: internal-registry.corp/payment-gateway:v2.1.4
        resources:
          requests:
            cpu: "250m"       # Anchored to 90th percentile of steady-state utilization
            memory: "512Mi"   # Anchored to 95th percentile of working set
          limits:
            cpu: "1000m"      # Allows 4x burst capability for JVM startup and traffic spikes
            memory: "768Mi"   # Provides a 1.5x buffer above peak utilization to prevent OOMKills
        ports:
        - containerPort: 8080
        livenessProbe:
          httpGet:
            path: /healthz
            port: 8080
          initialDelaySeconds: 15
          periodSeconds: 20
        readinessProbe:
          httpGet:
            path: /ready
            port: 8080
          initialDelaySeconds: 5
          periodSeconds: 10
Enforcing Guardrails and Governance
Manually adjusting YAML files is a losing battle in fast-paced engineering organizations. To maintain cluster hygiene, platform teams must establish automated governance policies and guardrails.
Enforcing Boundaries with LimitRanges
A LimitRange is a policy resource that allows you to set default requests and limits, as well as minimum and maximum resource constraints, for all containers within a specific namespace. If a developer attempts to deploy a pod without specifying resources, the admission controller automatically injects the default values defined in the LimitRange.
apiVersion: v1
kind: LimitRange
metadata:
  name: default-mem-cpu-limits
  namespace: development
spec:
  limits:
  - default:
      cpu: "500m"
      memory: "512Mi"
    defaultRequest:
      cpu: "100m"
      memory: "256Mi"
    max:
      cpu: "2000m"
      memory: "2Gi"
    min:
      cpu: "50m"
      memory: "64Mi"
    type: Container
Implementing Automated Policy Guardrails
While LimitRanges help inject defaults, they cannot prevent developers from requesting unnecessarily large resources (e.g., requesting 16 vCPUs for a basic web server). To enforce strict organizational policy, you should implement automated guardrails using admission controllers like Open Policy Agent (OPA) Gatekeeper or Kyverno.
These tools evaluate incoming deployment manifests against corporate policies and reject deployments that exceed pre-approved limits or violate security profiles. This ensures that misconfigured manifests never reach your production clusters in the first place.
Dynamic Scaling: VPA, HPA, and the Co-existence Dilemma
Static right-sizing is highly effective for stable workloads, but dynamic workloads require automated, real-time adjustments. Kubernetes provides two primary autoscaling mechanisms to handle this dynamically: the Horizontal Pod Autoscaler (HPA) and the Vertical Pod Autoscaler (VPA).
Horizontal Pod Autoscaler (HPA)
The HPA scales the number of pod replicas up or down based on target resource utilization (typically CPU or memory percentage). For example, if your pod has a CPU request of 200m and the HPA target is set to 70%, the HPA will spin up more replicas when the average CPU utilization across all pods exceeds 140m.
Vertical Pod Autoscaler (VPA)
The VPA dynamically adjusts the CPU and memory requests and limits of your pods based on historical usage. It operates in three modes:
Off: VPA only provides recommendations, allowing engineers to review suggestions without automated changes.
Initial: VPA assigns resource requests at pod creation time but does not modify running pods.
Auto: VPA dynamically evicts running pods and restarts them with updated, optimized resource values.
The Conflict: Why You Cannot Use HPA and VPA Together
A common architectural mistake is configuring both HPA and VPA to scale on the same resource metrics (e.g., CPU). This creates a destructive feedback loop:
CPU utilization spikes.
The HPA scales out, spinning up more replicas to distribute the load.
Simultaneously, the VPA detects the CPU spike and attempts to increase the resource requests of individual pods, which triggers pod restarts.
These restarts reduce active capacity, causing CPU utilization to spike even further on the remaining pods, resulting in cluster-wide instability.
The Solution: If you must use both, configure the HPA to scale on custom application metrics (such as HTTP request rate, queue depth, or Prometheus metrics) while using the VPA to manage resource sizing. Alternatively, restrict the VPA to "Off" (recommendation-only) mode and feed those recommendations into your continuous deployment pipelines.
How CloudAtler Unifies FinOps, Security, and Kubernetes Operations
Managing Kubernetes resource allocation manually across multiple clouds is an operational nightmare. Platform engineers are caught in a constant tug-of-war between developers demanding more resources and finance teams demanding cost reductions. This is where CloudAtler transforms your cloud operations.
CloudAtler provides a unified control plane that bridges the gap between Kubernetes performance telemetry, financial impact, and security compliance. By leveraging our Atler AI engine, organizations gain deep, predictive insights into their cluster utilization patterns. CloudAtler analyzes historical usage trends across AWS, Azure, GCP, and Oracle Cloud environments to generate exact, safe right-sizing recommendations that eliminate slack space without risking application performance.
For operations teams, our tailored infrastructure and SRE solutions automate the entire feedback loop. Instead of manually updating dozens of YAML files, CloudAtler identifies over-provisioned workloads, calculates the precise cost savings, and can safely apply resource adjustments using intelligent, policy-driven workflows. This eliminates the risk of OOMKills, prevents CPU throttling, and ensures your clusters run at peak efficiency.
Conclusion: Take Control of Your Kubernetes Spend and Performance
Right-sizing Kubernetes pods is not a one-time project; it is a continuous operational discipline. Over-provisioning may feel like a safe insurance policy, but it is an expensive and inefficient way to manage infrastructure. By understanding the underlying cgroup mechanisms, analyzing peak telemetry patterns, enforcing admission guardrails, and leveraging intelligent automation, you can significantly reduce your cloud spend while maintaining—and often improving—application reliability.
Stop overpaying for idle capacity and guessing your resource requirements. Partner with CloudAtler to unify your FinOps, security, and cloud operations under a single, AI-powered pane of glass. Get started with CloudAtler today and discover how easy it is to achieve safe, automated, and secure multi-cloud efficiency.
All in One Place
Atler Pilot decodes your cloud spend story by bringing monitoring, automation, and intelligent insights together for faster and better cloud operations.