
The Multi-Cloud Cost Crisis: Why Reactive Alerting Fails
Modern enterprise cloud architectures are distributed, highly dynamic, and increasingly multi-cloud. Organizations routinely leverage Amazon Web Services (AWS) for core compute, Microsoft Azure for enterprise integrations, Google Cloud Platform (GCP) for data analytics, and Oracle Cloud Infrastructure (OCI) for specialized database workloads. While this multi-cloud strategy maximizes operational flexibility and prevents vendor lock-in, it introduces a severe governance challenge: cost visibility and control.
Traditional FinOps practices rely heavily on reactive budgeting. Typically, an engineering team sets static monthly budgets or basic threshold alerts (e.g., "alert me when spend reaches 80% of the allocated budget"). By the time these alerts trigger, the damage is already done. A misconfigured Kubernetes autoscaler, an unoptimized database query looping over petabytes of cold storage, or a rogue data egress pipeline can rack up tens of thousands of dollars in a matter of hours. Reactive alerts merely act as an autopsy report for your cloud spend.
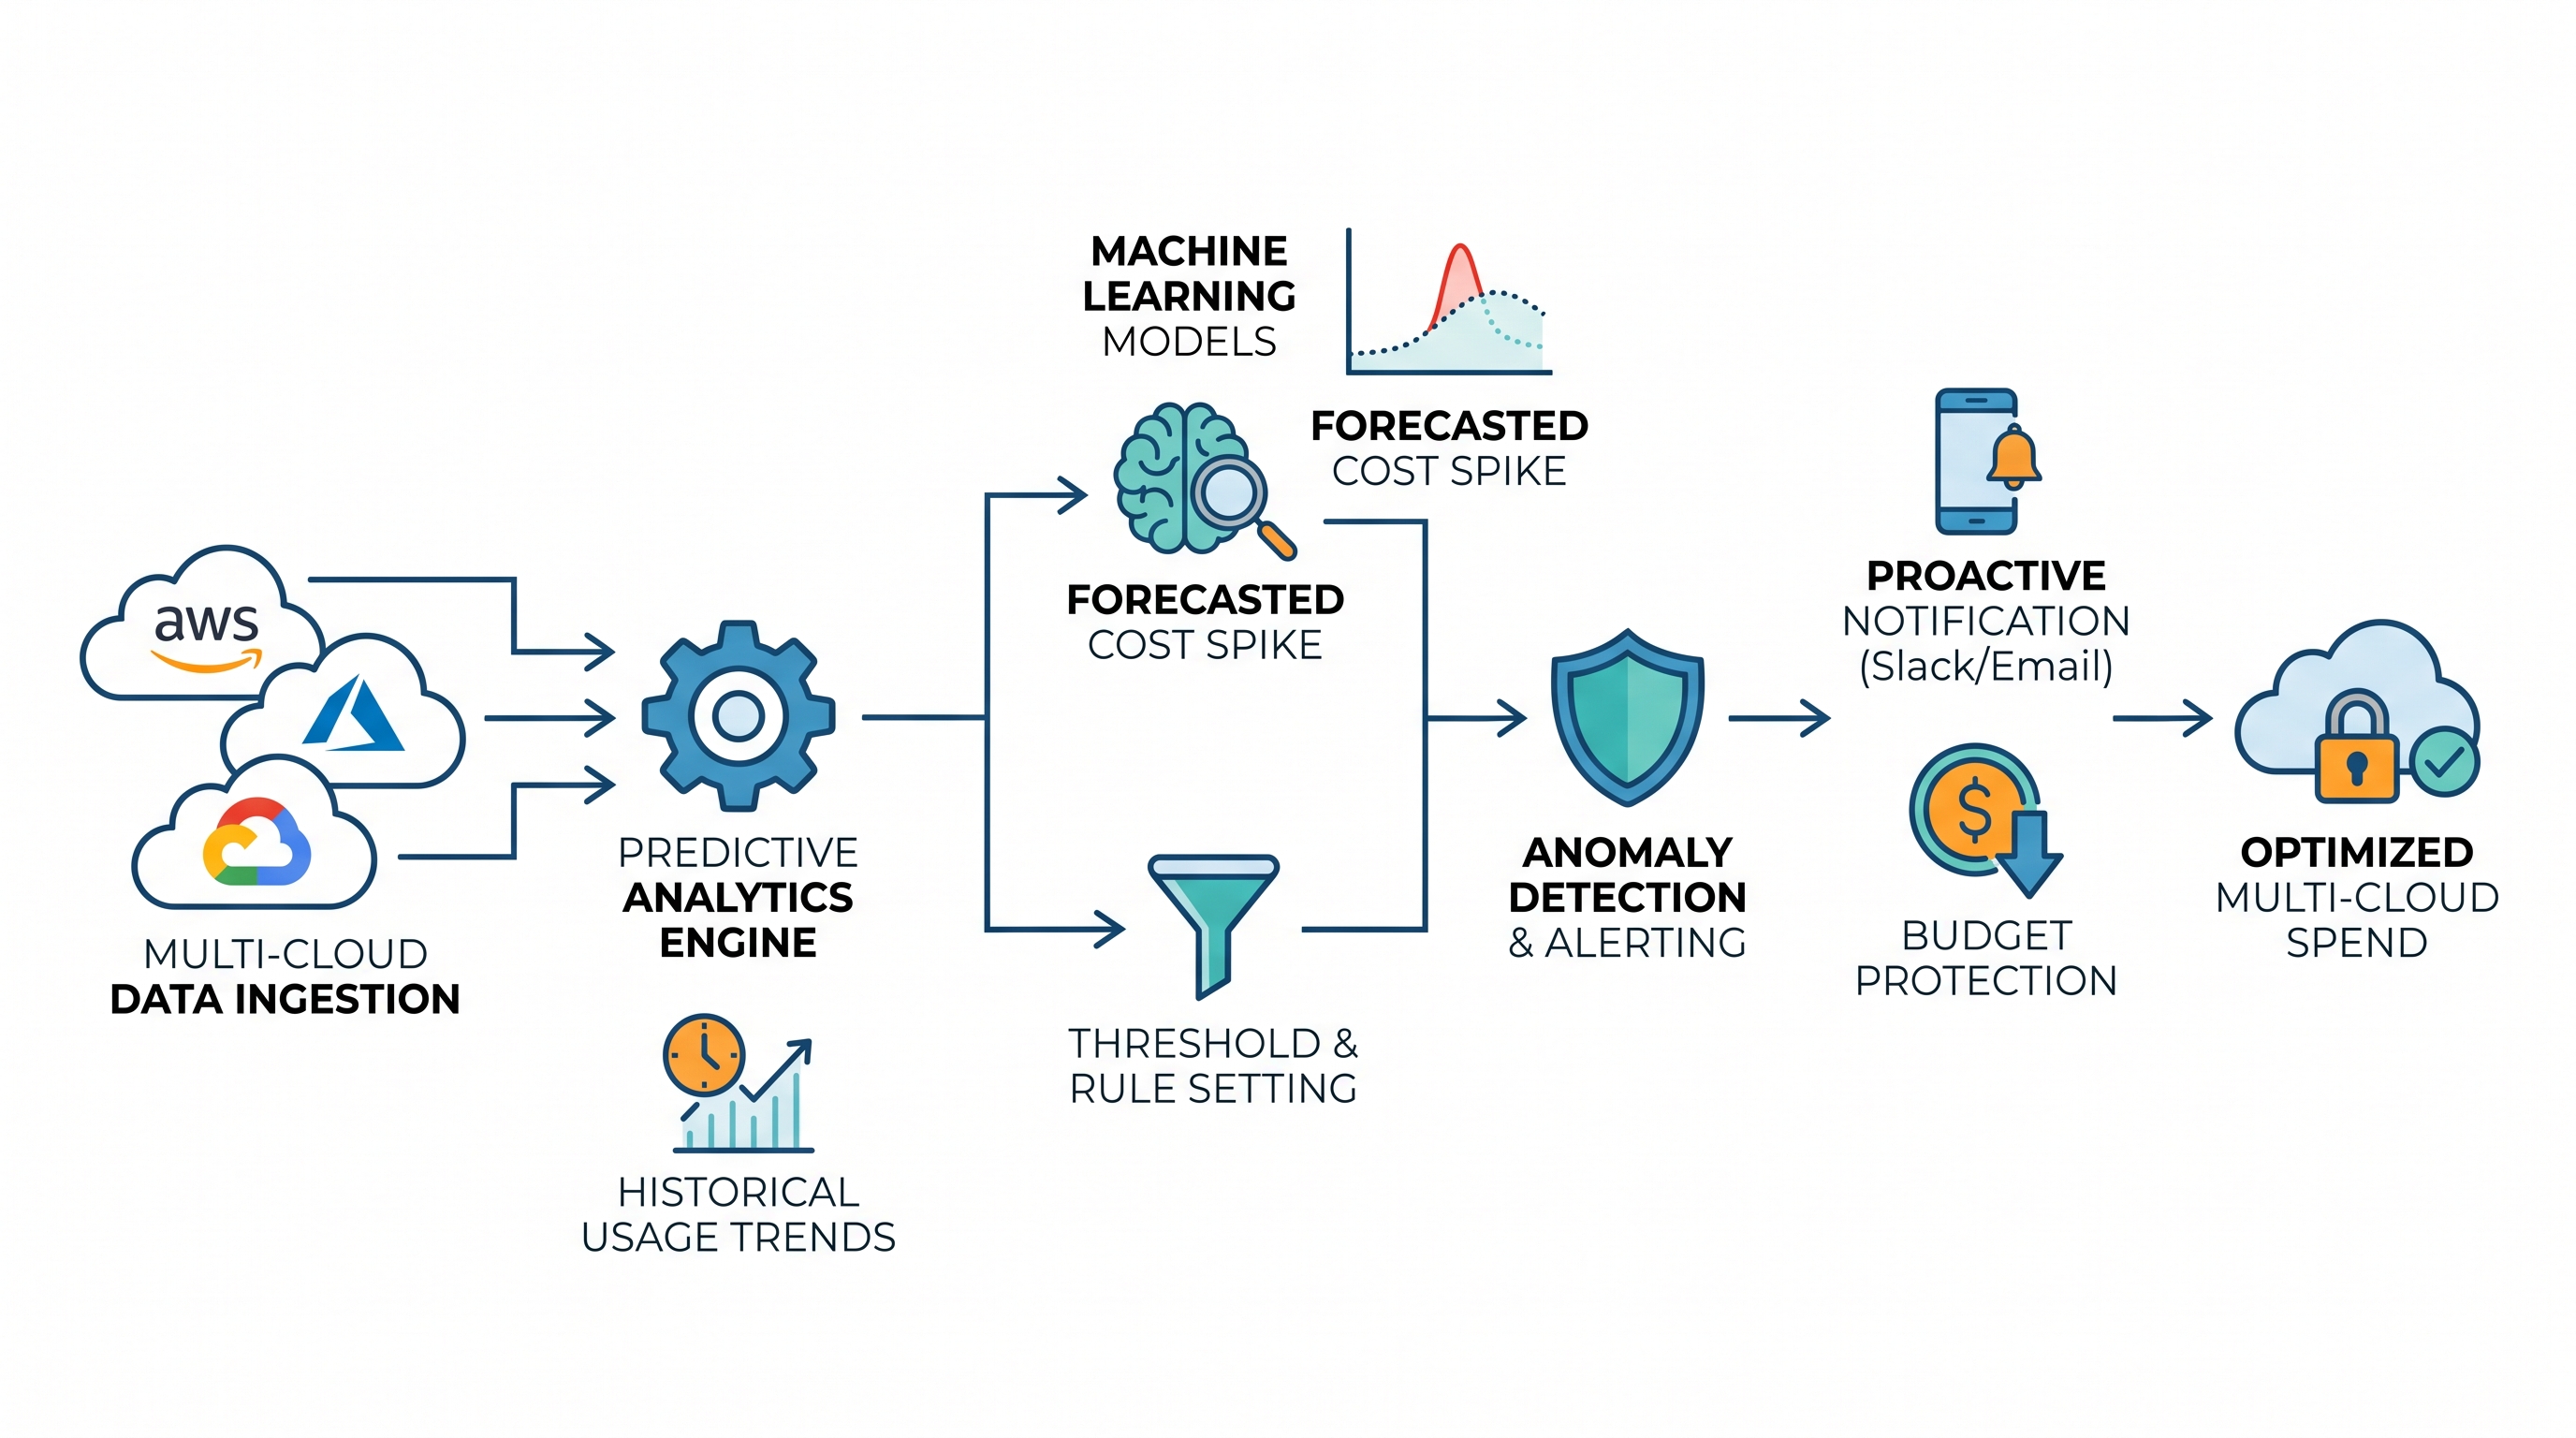
To survive in a multi-cloud environment, enterprises must shift from reactive alerting to predictive anomaly detection. This requires real-time data ingestion, normalization across disparate cloud billing APIs, and machine learning models capable of distinguishing normal operational variance (such as Black Friday traffic surges) from genuine cost anomalies (such as a compromised cloud account spinning up unauthorized GPU instances for cryptocurrency mining).
The Anatomy of a Multi-Cloud Cost Spike
Before designing a predictive detection system, we must understand the primary vectors of unexpected cloud cost spikes. In a multi-cloud architecture, these spikes generally fall into three categories: operational misconfigurations, architectural inefficiencies, and security breaches.
1. Operational Misconfigurations (The Runaway Process)
Consider a scenario where an engineer deploys an Apache Spark or Databricks job on AWS EMR. Due to a coding error in the retry logic, a failed task enters an infinite loop, continuously provisioning new spot or on-demand instances to complete the task. Within 12 hours, the cluster autoscaler provisions hundreds of high-memory instances. Because billing data can take up to 24 hours to propagate to AWS Cost Explorer, the team remains unaware of the runaway process until the daily billing report arrives, showing a $40,000 spike.
2. Architectural Inefficiencies (Data Egress Loops)
In multi-cloud setups, data transfer costs (egress) are a silent budget killer. Imagine a hybrid architecture where an application hosted on Azure Container Apps queries a PostgreSQL database hosted in GCP's us-central1 region. A database administrator enables a new logging feature that replicates raw database transactions back to an Azure Log Analytics workspace for auditing. If the replication protocol is uncompressed or runs over public internet routing rather than a dedicated VPN/ExpressRoute/Interconnect path, data egress charges on the GCP side will spike exponentially, transforming a minor architectural tweak into an enterprise financial crisis.
3. Cloud Security Breaches (Crypto-Jacking)
Cost anomalies are often the earliest indicator of a security compromise. If an attacker gains access to your cloud environment via leaked IAM credentials or an unpatched vulnerability, their goal is rarely immediate data destruction; instead, they seek to monetize their access. The most common vector is provisioning high-performance compute instances (such as AWS p4d.24xlarge or GCP a2-megagpu-16g) to mine cryptocurrency. These instances cost upwards of $32 per hour each. If an attacker provisions 50 of these instances across multiple regions, your organization will incur over $38,000 in charges per day.
Implementing a unified platform like CloudAtler's financial command center allows organizations to aggregate these disparate billing streams into a single pane of glass, ensuring that operational, architectural, and security-driven cost spikes are identified in near-real-time.
Designing a Predictive Anomaly Detection Architecture
To detect cost anomalies before they escalate, you must build or adopt a real-time predictive pipeline. This pipeline consists of four distinct phases: data ingestion, normalization, predictive modeling, and automated alerting/remediation.
Pipeline Phase | AWS Components | Azure Components | GCP Components |
|---|---|---|---|
1. Data Ingestion | Cost & Usage Report (CUR) to S3, CloudWatch Metrics | Azure Consumption API, Monitor Metrics to Event Hubs | Billing Export to BigQuery, Cloud Monitoring Metrics |
2. Normalization | ETL Layer (Spark/Glue) mapping schemas to unified parquet format (Common Schema) | ||
3. Modeling Engine | Machine Learning Engine (Prophet, Isolation Forests, LSTM Neural Networks) | ||
4. Remediation | Lambda / Systems Manager | Azure Functions | Cloud Run / Cloud Functions |
Table 1: Unified Multi-Cloud Predictive Cost Pipeline Architecture
Phase 1: Multi-Cloud Billing and Telemetry Ingestion
The primary challenge in multi-cloud FinOps is the latency and format discrepancy of billing data. AWS writes Cost & Usage Reports (CUR) to S3 buckets up to several times a day. Azure delivers billing data via the Azure Export tool to Azure Blob Storage. GCP streams billing data directly into Google BigQuery. To build a predictive model, relying solely on these batch billing files is insufficient because of their inherent 4-to-24-hour propagation delay.
To solve this, we must augment billing data with real-time infrastructure telemetry. This includes tracking resource utilization metrics such as CPU usage, network egress bytes, disk I/O, and API call volume via AWS CloudWatch, Azure Monitor, and GCP Cloud Monitoring. These metrics act as leading indicators of cost. A 400% spike in network egress bytes or a sudden cluster-wide CPU utilization jump of 95% indicates an imminent cost spike hours before the billing API reflects the monetary increase.
Phase 2: Data Normalization and Schema Mapping
Once ingested, the raw telemetry and billing data must be normalized into a unified schema. Each cloud provider uses different nomenclature for identical concepts. For example, a virtual machine is an EC2 Instance in AWS, a Virtual Machine in Azure, and a Compute Engine Instance in GCP. Similarly, resource tags (or labels) are formatted differently across platforms.
Your ETL (Extract, Transform, Load) pipeline must map these disparate data streams into a standardized schema. A typical normalized cost record should contain the following fields:
timestamp: UTC ISO 8601 formatprovider: aws | azure | gcp | ociresource_id: Unique identifier (ARN, Resource ID, or self-link)service_category: compute | storage | database | network | securitycost_metric: amortized_cost | unblended_cost | utilization_metric_valuetags: Standardized key-value pairs (e.g.,environment,owner,project)
Phase 3: Selecting and Training Predictive Machine Learning Models
Once you have a normalized stream of cost and utilization telemetry, you can apply predictive algorithms. Static thresholds (e.g., alert if daily spend > $5,000) fail because they do not account for natural business cycles. A retail application naturally spends more on weekends or during holiday seasons. A financial application might experience cost spikes at the end of every fiscal quarter due to batch reporting jobs.
To handle seasonality, trend variations, and noise, we leverage three primary machine learning models:
A. Prophet (Additive Regressive Model)
Developed by Meta, Prophet is highly effective for forecasting time-series data that displays strong seasonal patterns (daily, weekly, yearly) and accounts for historical holidays or promotional events. The mathematical formulation of Prophet is represented as:
y(t) = g(t) + s(t) + h(t) + ε_t
Where:
g(t)represents the trend function, modeling non-periodic changes in cost.s(t)represents periodic changes (e.g., weekly or daily seasonality).h(t)represents the effects of holidays or scheduled batch events.ε_trepresents the error term (any unusual changes not accommodated by the model).
By fitting historical cloud spend to Prophet, you can establish a dynamic baseline with upper and lower bounds. If actual spend or utilization metrics breach the upper bound of the confidence interval, the system flags it as an anomaly.
B. Isolation Forests (Unsupervised Anomaly Detection)
While Prophet is excellent for univariate time-series (like total daily spend), cloud cost anomalies are often multi-dimensional. For instance, a cost spike might be normal if accompanied by a corresponding spike in application transactions, but highly anomalous if transaction volume remains flat. Isolation Forests isolate anomalies by randomly selecting a feature and then randomly selecting a split value between the maximum and minimum values of the selected feature.
Since anomalies require fewer splits to isolate than normal data points, they appear closer to the root of the decision trees. This allows the system to evaluate multiple dimensions simultaneously (e.g., CPU utilization, network egress, and hourly cost run rate) to calculate an anomaly score.
C. Long Short-Term Memory (LSTM) Networks
For highly complex, non-linear multi-cloud environments, Recurrent Neural Networks (RNNs) utilizing LSTM cells provide state-of-the-art predictive capabilities. LSTMs can retain memory of long-term dependencies in time-series data, allowing them to predict future cost trajectories based on sequential patterns of infrastructure scaling. This model is particularly useful for identifying slow-burning cost leaks—such as a database slowly accumulating unreferenced snapshots over six months—which traditional time-series models might classify as a normal upward trend.
Deploying and managing these complex ML pipelines manually requires significant data engineering overhead. To bypass this complexity, enterprises deploy CloudAtler's Atler AI engine, which automatically ingests multi-cloud telemetry and applies optimized, pre-tuned anomaly detection models out of the box.
Implementing Automated Remediation and Guardrails
Identifying an anomaly is only half the battle. If your predictive system alerts an engineer at 2:00 AM on a Sunday, it may take hours for them to log in, identify the root cause, and apply a fix. During those hours, thousands of dollars are wasted. True FinOps maturity requires shifting from "predictive alerting" to "automated containment."
However, automated remediation carries risk. If your automated script misidentifies a legitimate traffic surge as an anomaly and shuts down a production database, the resulting downtime could cost far more than the cloud cost spike itself. Therefore, you must implement intelligent guardrails.
Designing a Multi-Stage Automated Remediation Workflow
A robust remediation architecture follows a tiered response model based on the confidence score of the anomaly and the classification of the affected environment (e.g., non-production vs. production).
[Anomaly Detected]
       │
       ▼
Is Environment Non-Prod?
 ├── YES ──► Anomaly Score > 0.85? ──► YES ──► Auto-Terminate/Scale Down & Notify
 │                                   └── NO  ──► Send Slack Alert with SlackOps Buttons
 │
 └── NO  ──► Anomaly Score > 0.95? ──► YES ──► Apply Non-Disruptive Guardrail (e.g., Throttling)
                                     └── NO  ──► Page On-Call Engineer & Log Incident
Step 1: Environment Classification
Remediation scripts must query the resource tags. If a resource lacks an environment tag (e.g., Env=Prod), the system should default to the strictest safety settings. In development or staging environments, the system can afford to be aggressive. If a development EMR cluster spikes beyond its predicted daily cost threshold by 200%, the remediation engine should automatically terminate the cluster and notify the owner via Slack or MS Teams.
Step 2: Non-Disruptive Guardrails for Production
In production environments, direct resource termination is rarely acceptable. Instead, the remediation engine should apply non-disruptive mitigation tactics:
Auto-Throttling: If a Kubernetes cluster in GCP is scaling rapidly due to a suspected queue processing loop, the system can temporarily cap the maximum node count of the node pool, preventing further scaling while keeping existing nodes online.
Network Security Group (NSG) Modification: If a database in Azure is experiencing a massive egress spike to an unrecognized external IP address, the remediation script can automatically modify the NSG rules to block that specific IP, halting the egress loop without taking the database offline.
IAM Session Revocation: If an anomaly is flagged as a potential crypto-jacking event (e.g., sudden deployment of GPU instances in unused regions), the system should immediately revoke the active sessions of the IAM user or role that initiated the deployments and place a temporary policy lock on that identity.
Sample Automation Script: AWS EC2 Auto-Scaling Cap
Below is a Python script designed for an AWS Lambda function. When triggered by a high-confidence cost anomaly alert from the prediction engine, it dynamically caps the maximum capacity of a target Auto Scaling Group (ASG) to prevent further cost escalation.
import boto3
import os
import logging

logger = logging.getLogger()
logger.setLevel(logging.INFO)

asg_client = boto3.client('autoscaling')

def lambda_handler(event, context):
    # Parse anomaly payload
    asg_name = event.get('resource_id')
    anomaly_score = event.get('anomaly_score')
    environment = event.get('environment', 'dev')

    logger.info(f"Received anomaly alert for ASG: {asg_name} with score: {anomaly_score}")

    if anomaly_score < 0.85:
        logger.info("Anomaly score below threshold for automated action. Alerting only.")
        return {"status": "skipped", "reason": "low_confidence"}

    try:
        # Describe the target Auto Scaling Group
        response = asg_client.describe_auto_scaling_groups(AutoScalingGroupNames=[asg_name])
        if not response['AutoScalingGroups']:
            logger.error(f"ASG {asg_name} not found.")
            return {"status": "error", "reason": "asg_not_found"}

        asg = response['AutoScalingGroups'][0]
        current_max = asg['MaxSize']
        current_desired = asg['DesiredCapacity']

        # Guardrail logic: Cap the MaxSize to the current Desired Capacity to freeze scaling
        if current_max > current_desired:
            logger.info(f"Capping ASG {asg_name} MaxSize from {current_max} to {current_desired}")

            # Apply cap
            asg_client.update_auto_scaling_group(
                AutoScalingGroupName=asg_name,
                MaxSize=current_desired
            )

            # Send notification hook (e.g., Slack/Teams)
            send_notification(asg_name, current_max, current_desired, environment)
            return {"status": "remediated", "action": "max_size_capped"}
        else:
            logger.info(f"ASG {asg_name} is already operating at or below desired capacity.")
            return {"status": "skipped", "reason": "already_capped"}

    except Exception as e:
        logger.error(f"Failed to apply guardrail to {asg_name}: {str(e)}")
        raise e

def send_notification(asg_name, old_max, new_max, env):
    # Placeholder for webhook notification logic
    logger.info(f"Notification sent: {asg_name} capped in {env} environment.")
By coupling predictive insights with automated code execution, organizations transition from a defensive posture to active cost defense. Utilizing CloudAtler's budget control alerts, you can natively orchestrate these automated remediation scripts across multi-cloud environments without writing and maintaining custom Lambda or Azure Function code.
FinOps and Cloud Security: The Convergence of Cost and Threat Detection
Historically, FinOps and Cloud Security (SecOps) operated in silos. FinOps teams analyzed monthly bills to optimize commitments and right-size instances, while SecOps teams monitored CloudTrail and VPC Flow Logs for indicators of compromise (IoCs). However, in a multi-cloud paradigm, cost anomalies and security threats are heavily intertwined.
A sudden, unexplained cost spike is often the first visible indicator of a sophisticated security breach. Sophisticated attackers who infiltrate a cloud environment frequently attempt to bypass security information and event management (SIEM) detection by performing low-and-slow data exfiltration or spinning up workloads in obscure cloud regions (such as AWS ap-east-1 or Azure South Africa North) where the target enterprise has no active deployments. Traditional security scanners may miss these regional deployments if they are only configured to monitor primary operating regions.
A multi-cloud predictive cost anomaly engine, however, monitors global billing APIs and telemetry streams. It will immediately flag the cost associated with provisioning resources in an inactive region, exposing the security breach. By integrating cost telemetry into your security operations, you achieve a unified defensive posture.
Leveraging Unified Platforms for Strategic Advantage
For organizations looking to scale their cloud footprint without scaling their operational overhead, managing separate tools for FinOps, cloud security, and infrastructure automation is unsustainable. A unified platform eliminates the tool sprawl and context switching that slows down incident response.
By leveraging CloudAtler's predictive monitoring and operations, enterprise IT leaders, security engineers, and finance professionals can collaborate within a single platform. When an anomaly is detected, the platform correlates the financial impact with active security vulnerabilities and operational performance metrics, providing a comprehensive root-cause analysis that allows teams to make fast, informed decisions.
Conclusion: Take Control of Your Multi-Cloud Spend
Predictive cost anomaly detection is no longer a luxury; it is a fundamental requirement for any enterprise operating a multi-cloud infrastructure. The speed at which modern cloud resources scale means that a single misconfiguration or security breach can consume an entire quarterly budget in a weekend. By implementing real-time data ingestion, normalizing multi-cloud telemetry, applying advanced machine learning models like Prophet and Isolation Forests, and establishing automated remediation guardrails, you protect your organization's bottom line and secure your cloud environments.
Building and maintaining these complex data pipelines and ML models in-house is a massive undertaking that distracts your engineering teams from delivering core business value. CloudAtler provides a comprehensive, out-of-the-box solution that unifies FinOps, cloud security, and automated operations across AWS, Azure, GCP, and Oracle environments. Our platform acts as your financial command center, giving you the predictive foresight and automated capabilities needed to stop cost spikes before they ruin your budget.
Stop reacting to yesterday's cloud costs. Empower your organization with the industry's most advanced, AI-driven multi-cloud optimization platform. To learn how you can achieve complete visibility and automated control over your cloud spend, explore CloudAtler's FinOps solutions for CIOs or contact our technical team today to schedule a customized demo of the CloudAtler platform.
All in One Place
Atler Pilot decodes your cloud spend story by bringing monitoring, automation, and intelligent insights together for faster and better cloud operations.