
The ROI Problem in FinOps
The most dangerous moment for a FinOps team occurs roughly 18 months into its existence. The team has successfully picked the low-hanging fruit: orphaned instances are deleted, massive rightsizing efforts are complete, and commitment coverage is stabilized at 80%. The cloud bill has flattened. Consequently, the CFO looks at the cost of the FinOps team—salaries, specialized tooling, engineering time spent on optimization—and asks a fatal question: "We are not saving millions anymore. Do we still need this level of investment?"
This happens because the FinOps team failed to prove its ongoing Return on Investment (ROI) beyond initial gross savings. If a FinOps practice measures success solely by "dollars saved," it mathematically engineers its own obsolescence. The goal of FinOps is not to minimize the cloud bill; the goal is to maximize the business value derived from every cloud dollar spent.
Proving FinOps ROI requires a shift from reporting gross cost reductions to reporting efficiency metrics, unit economics, and avoided costs. This guide provides the framework for calculating, proving, and reporting FinOps ROI to executive leadership.
Moving Beyond the Total Bill: Unit Economics
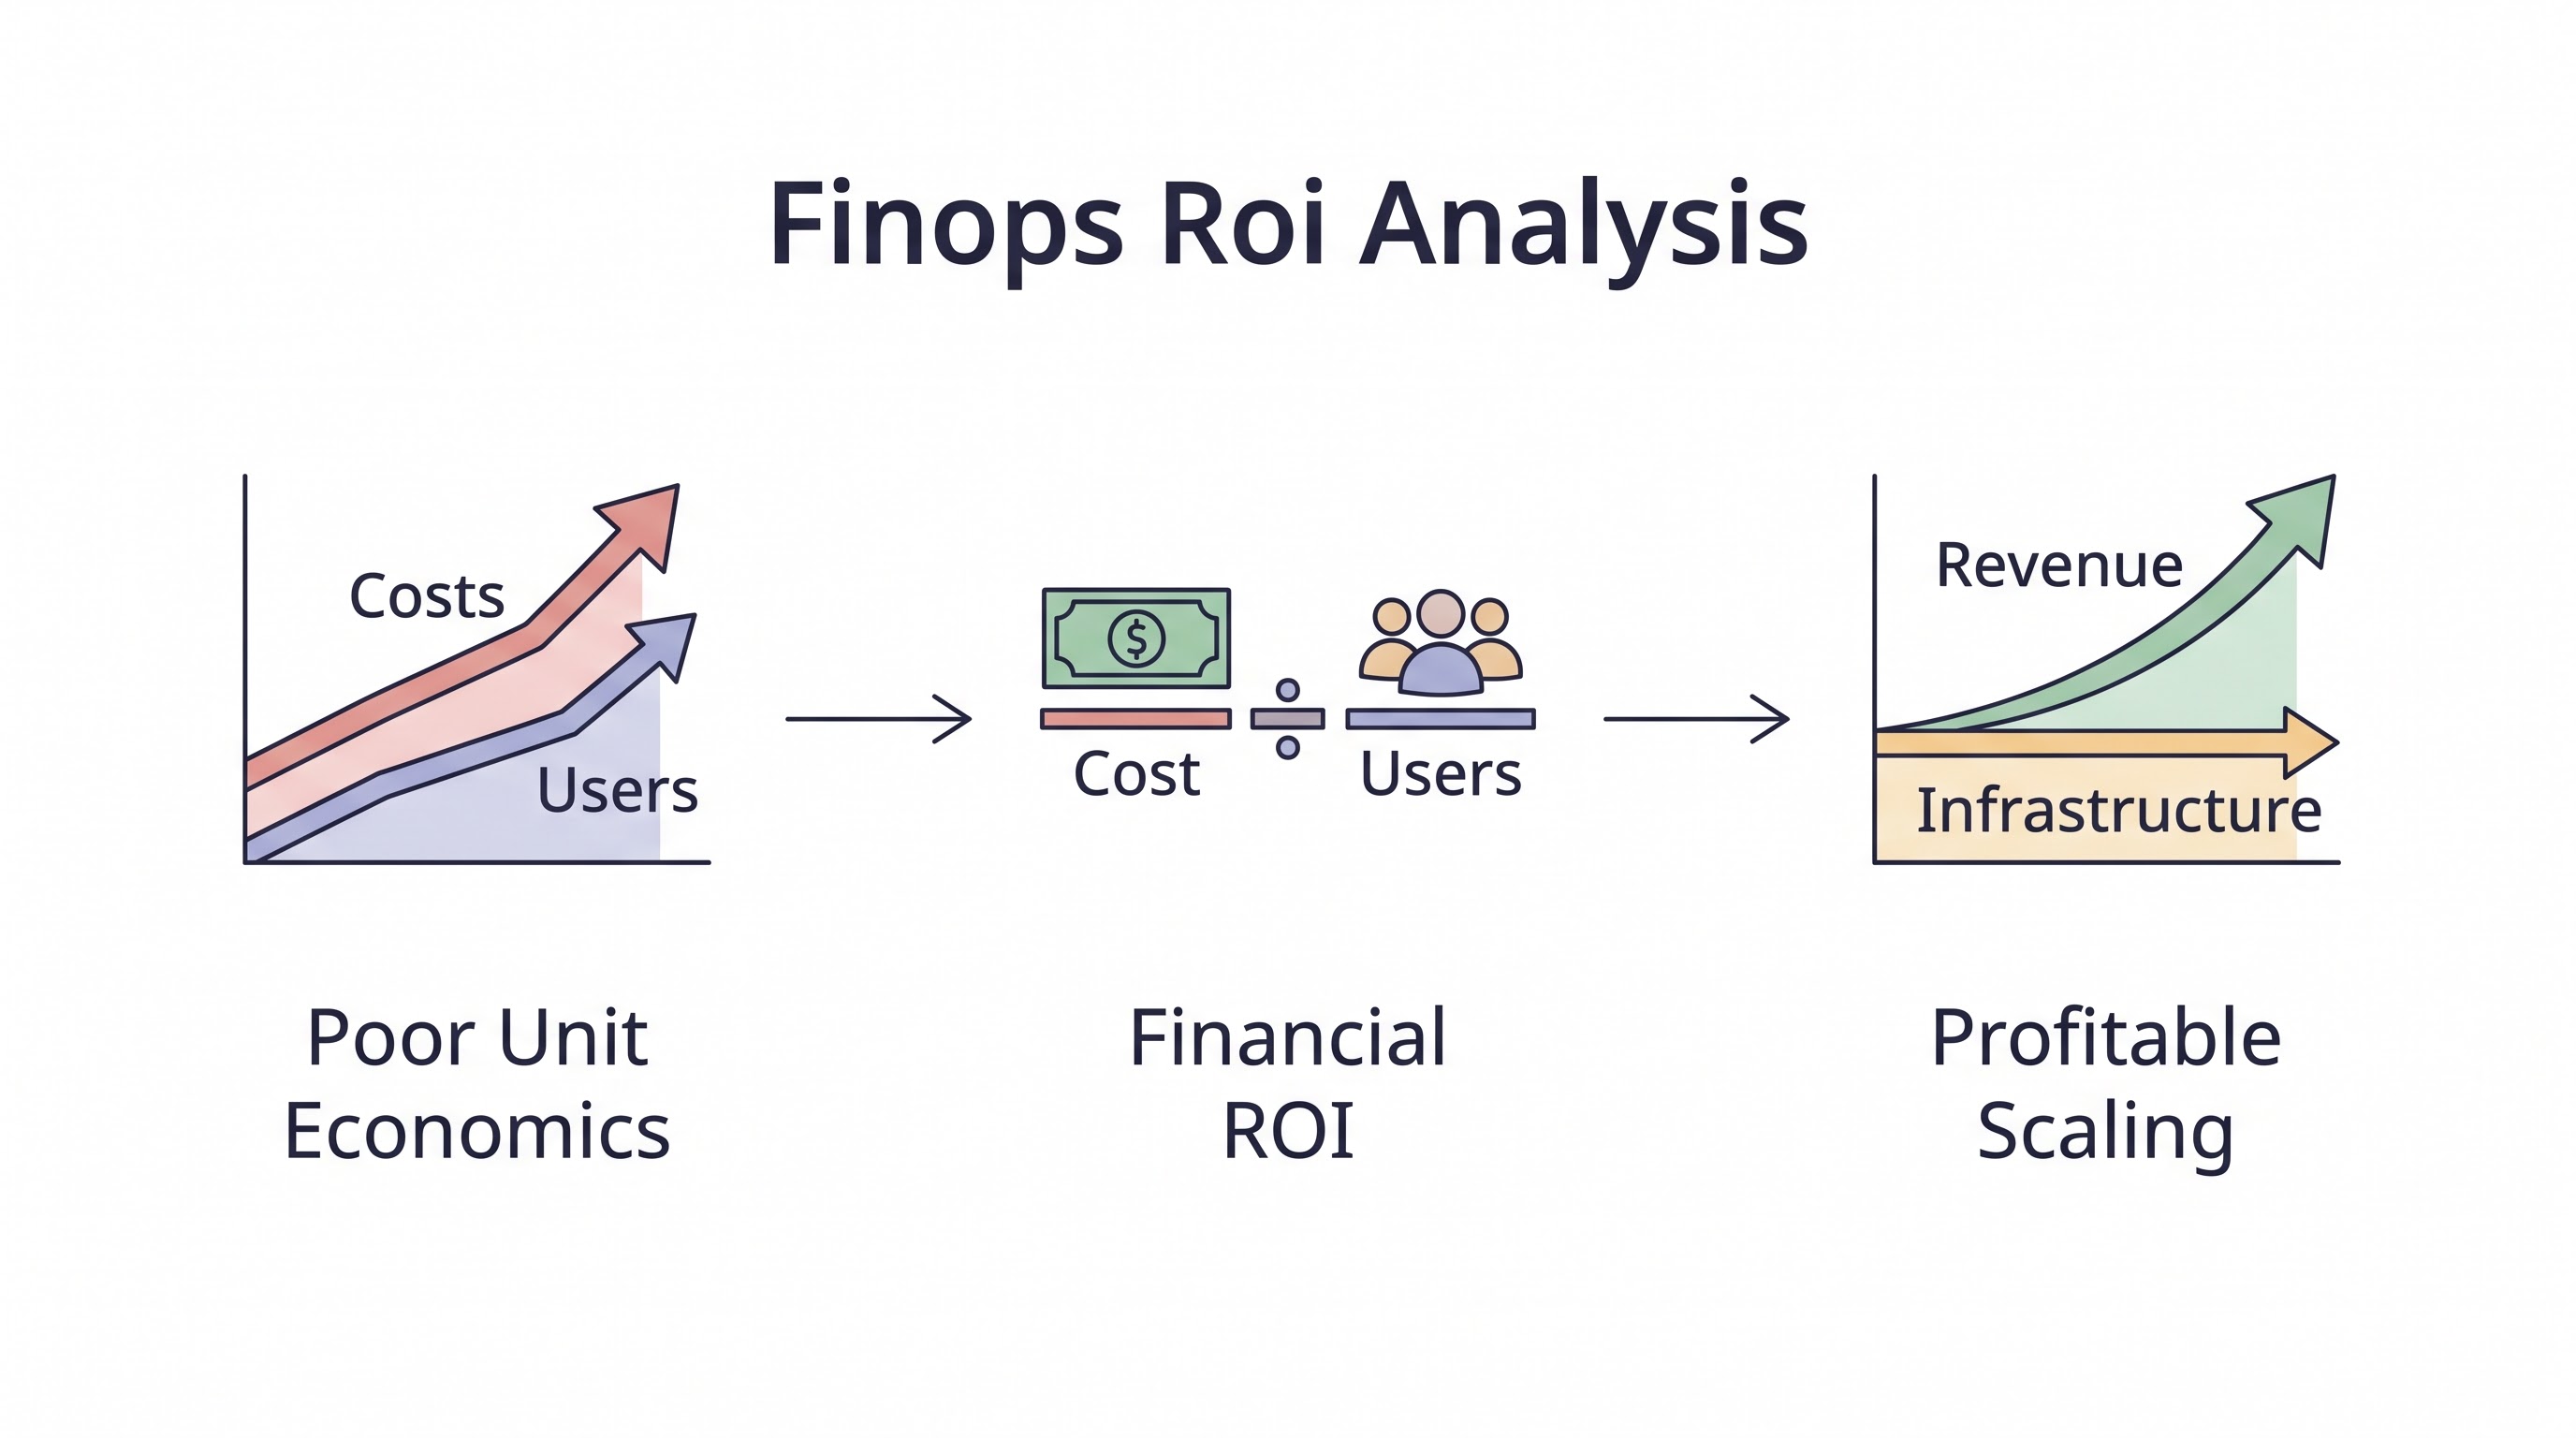
A rising cloud bill is not inherently bad. If the cloud bill increases by 20%, but the business processes 50% more transactions, the infrastructure has become significantly more efficient. Reporting only the total bill obscures this success.
The core of mature FinOps ROI analysis is Cloud Unit Economics. This involves dividing the cloud cost by a business metric to create a ratio that proves efficiency. Examples include:
E-commerce: Cloud cost per transaction, cost per order processed.
SaaS: Cloud cost per active tenant, cost per API request, cost per daily active user (DAU).
Media: Cloud cost per hour of streamed video.
When the FinOps team can present a chart showing the total cloud bill rising, but the cost per transaction dropping by 15% year-over-year, they have proven structural ROI. They have demonstrated that their optimization efforts are creating operating leverage for the business.
The FinOps KPI Framework
To calculate ROI, you must track the right Key Performance Indicators (KPIs). The FinOps Framework categorizes metrics to ensure a holistic view of performance.
Efficiency KPIs
These measure how well resources are utilized:
Commitment Coverage: Percentage of eligible compute usage covered by RIs/Savings Plans/CUDs (Target: 70-85%).
Commitment Utilization: Percentage of purchased commitments actually consumed (Target: >95%).
Compute Resource Utilization: Average and 95th percentile CPU/Memory utilization across the fleet, indicating rightsizing success.
Agility and Governance KPIs
These measure operational maturity:
Tagging Compliance: Percentage of resources successfully tagged with required cost allocation tags (Target: >95%).
Anomaly Resolution Time: The time elapsed between detecting a cloud cost anomaly and resolving it.
Forecast Accuracy: The variance between forecasted budget and actual spend (Target: within 5-10%).
Calculating the Hard ROI of FinOps
The standard ROI formula applies to FinOps: (Net Savings & Value Created / Cost of Investment) x 100.
1. Identify the Cost of Investment
Calculate the Fully Loaded Cost of the FinOps practice. This includes:
Salaries of dedicated FinOps practitioners and analysts.
Estimated engineering hours spent implementing optimizations (e.g., rightsizing, refactoring for cost).
Cost of third-party FinOps tooling and platforms.
2. Calculate Net Savings
Net savings are the tangible, realized reductions in the bill compared to the baseline trajectory. This includes:
Rate Optimization Savings: Dollars saved via discount negotiations, Reserved Instances, and Savings Plans compared to on-demand rates.
Usage Optimization Savings: Dollars saved by terminating idle resources, rightsizing instances, and implementing scheduling automation.
Example: A FinOps practice costs $400,000 annually. They generate $1.2M in rate savings and $600,000 in usage savings. Hard ROI = (($1.8M - $400k) / $400k) x 100 = 350% ROI.
The Challenge of Avoided Costs
Hard savings are visible on the bill. Avoided costs are invisible but equally important. Avoided costs represent money the company would have spent if the FinOps team had not intervened.
Examples of Avoided Costs:
Anomaly Prevention: An anomaly alert catches a runaway Lambda function 2 hours after deployment. Left unchecked for a month, it would have cost $50,000. The avoided cost is $49,900.
Architecture Reviews: The FinOps team reviews a proposed architecture and identifies a data transfer inefficiency. They alter the design, saving an estimated $10,000/month before the infrastructure is even built.
While executives are skeptical of "soft savings," a rigorous log of avoided costs is crucial. Track these interventions in a central registry. When defending the FinOps budget, presenting a documented ledger of prevented disasters is a powerful argument for the team's continued existence.
Building the Executive Reporting Deck
Engineers care about CPU utilization; executives care about margins and predictability. The monthly FinOps executive report should fit on a few slides and focus on business outcomes.
The Executive Dashboard Structure:
Headline Metric: Unit Cost Trend (e.g., "Cost per 1,000 API calls decreased by 4% this month").
Budget vs. Actuals: Are we tracking to forecast? Highlight variances and explain why they occurred (e.g., "Unplanned marketing push drove compute spikes").
Commitment Health: Current coverage (82%) and utilization (98%), translating percentages into effective discount rates.
Optimization Highlights: Top 3 optimization actions taken this month and their annualized financial impact.
Action Required: Clear asks from leadership (e.g., "Need VP approval to enforce a new tagging policy shutting down untagged dev resources").
Connecting FinOps to Cloud TCO
FinOps ROI analysis must eventually connect to the broader Total Cost of Ownership (TCO). Cloud TCO includes not just the AWS/Azure/GCP bill, but also the human capital required to maintain the infrastructure, security tooling, and downtime costs.
Effective FinOps reduces TCO by automating away toil. When FinOps and DevOps align, teams spend less time manually investigating billing spikes and more time building features. While harder to quantify, demonstrating that FinOps tooling has reduced the time engineers spend on cost attribution from 10 hours a month to 1 hour a month is a significant TCO victory.
The ROI of FinOps Automation
The highest ROI in a mature practice comes from transitioning from manual analysis to automation. Manual rightsizing analysis takes hours and becomes outdated quickly. Implementing a platform that automatically applies cost saving recommendations or enforces budget limits via policy-as-code generates continuous returns without additional human effort.
Platforms like CloudAtler provide the automated reporting, anomaly detection, and unified visibility required to not only achieve optimization but to continuously prove the ROI of those efforts to the C-suite.
Key Takeaway
Proving FinOps ROI is the only way to sustain the practice long-term. Do not rely on gross savings, which inevitably diminish over time. Shift the narrative to Cloud Unit Economics to prove operational leverage. Rigorously track both hard savings (commitments, rightsizing) and avoided costs (prevented anomalies). Report to executives using business metrics, focusing on efficiency, forecast accuracy, and the value generated by FinOps automation.
All in One Place
Atler Pilot decodes your cloud spend story by bringing monitoring, automation, and intelligent insights together for faster and better cloud operations.