
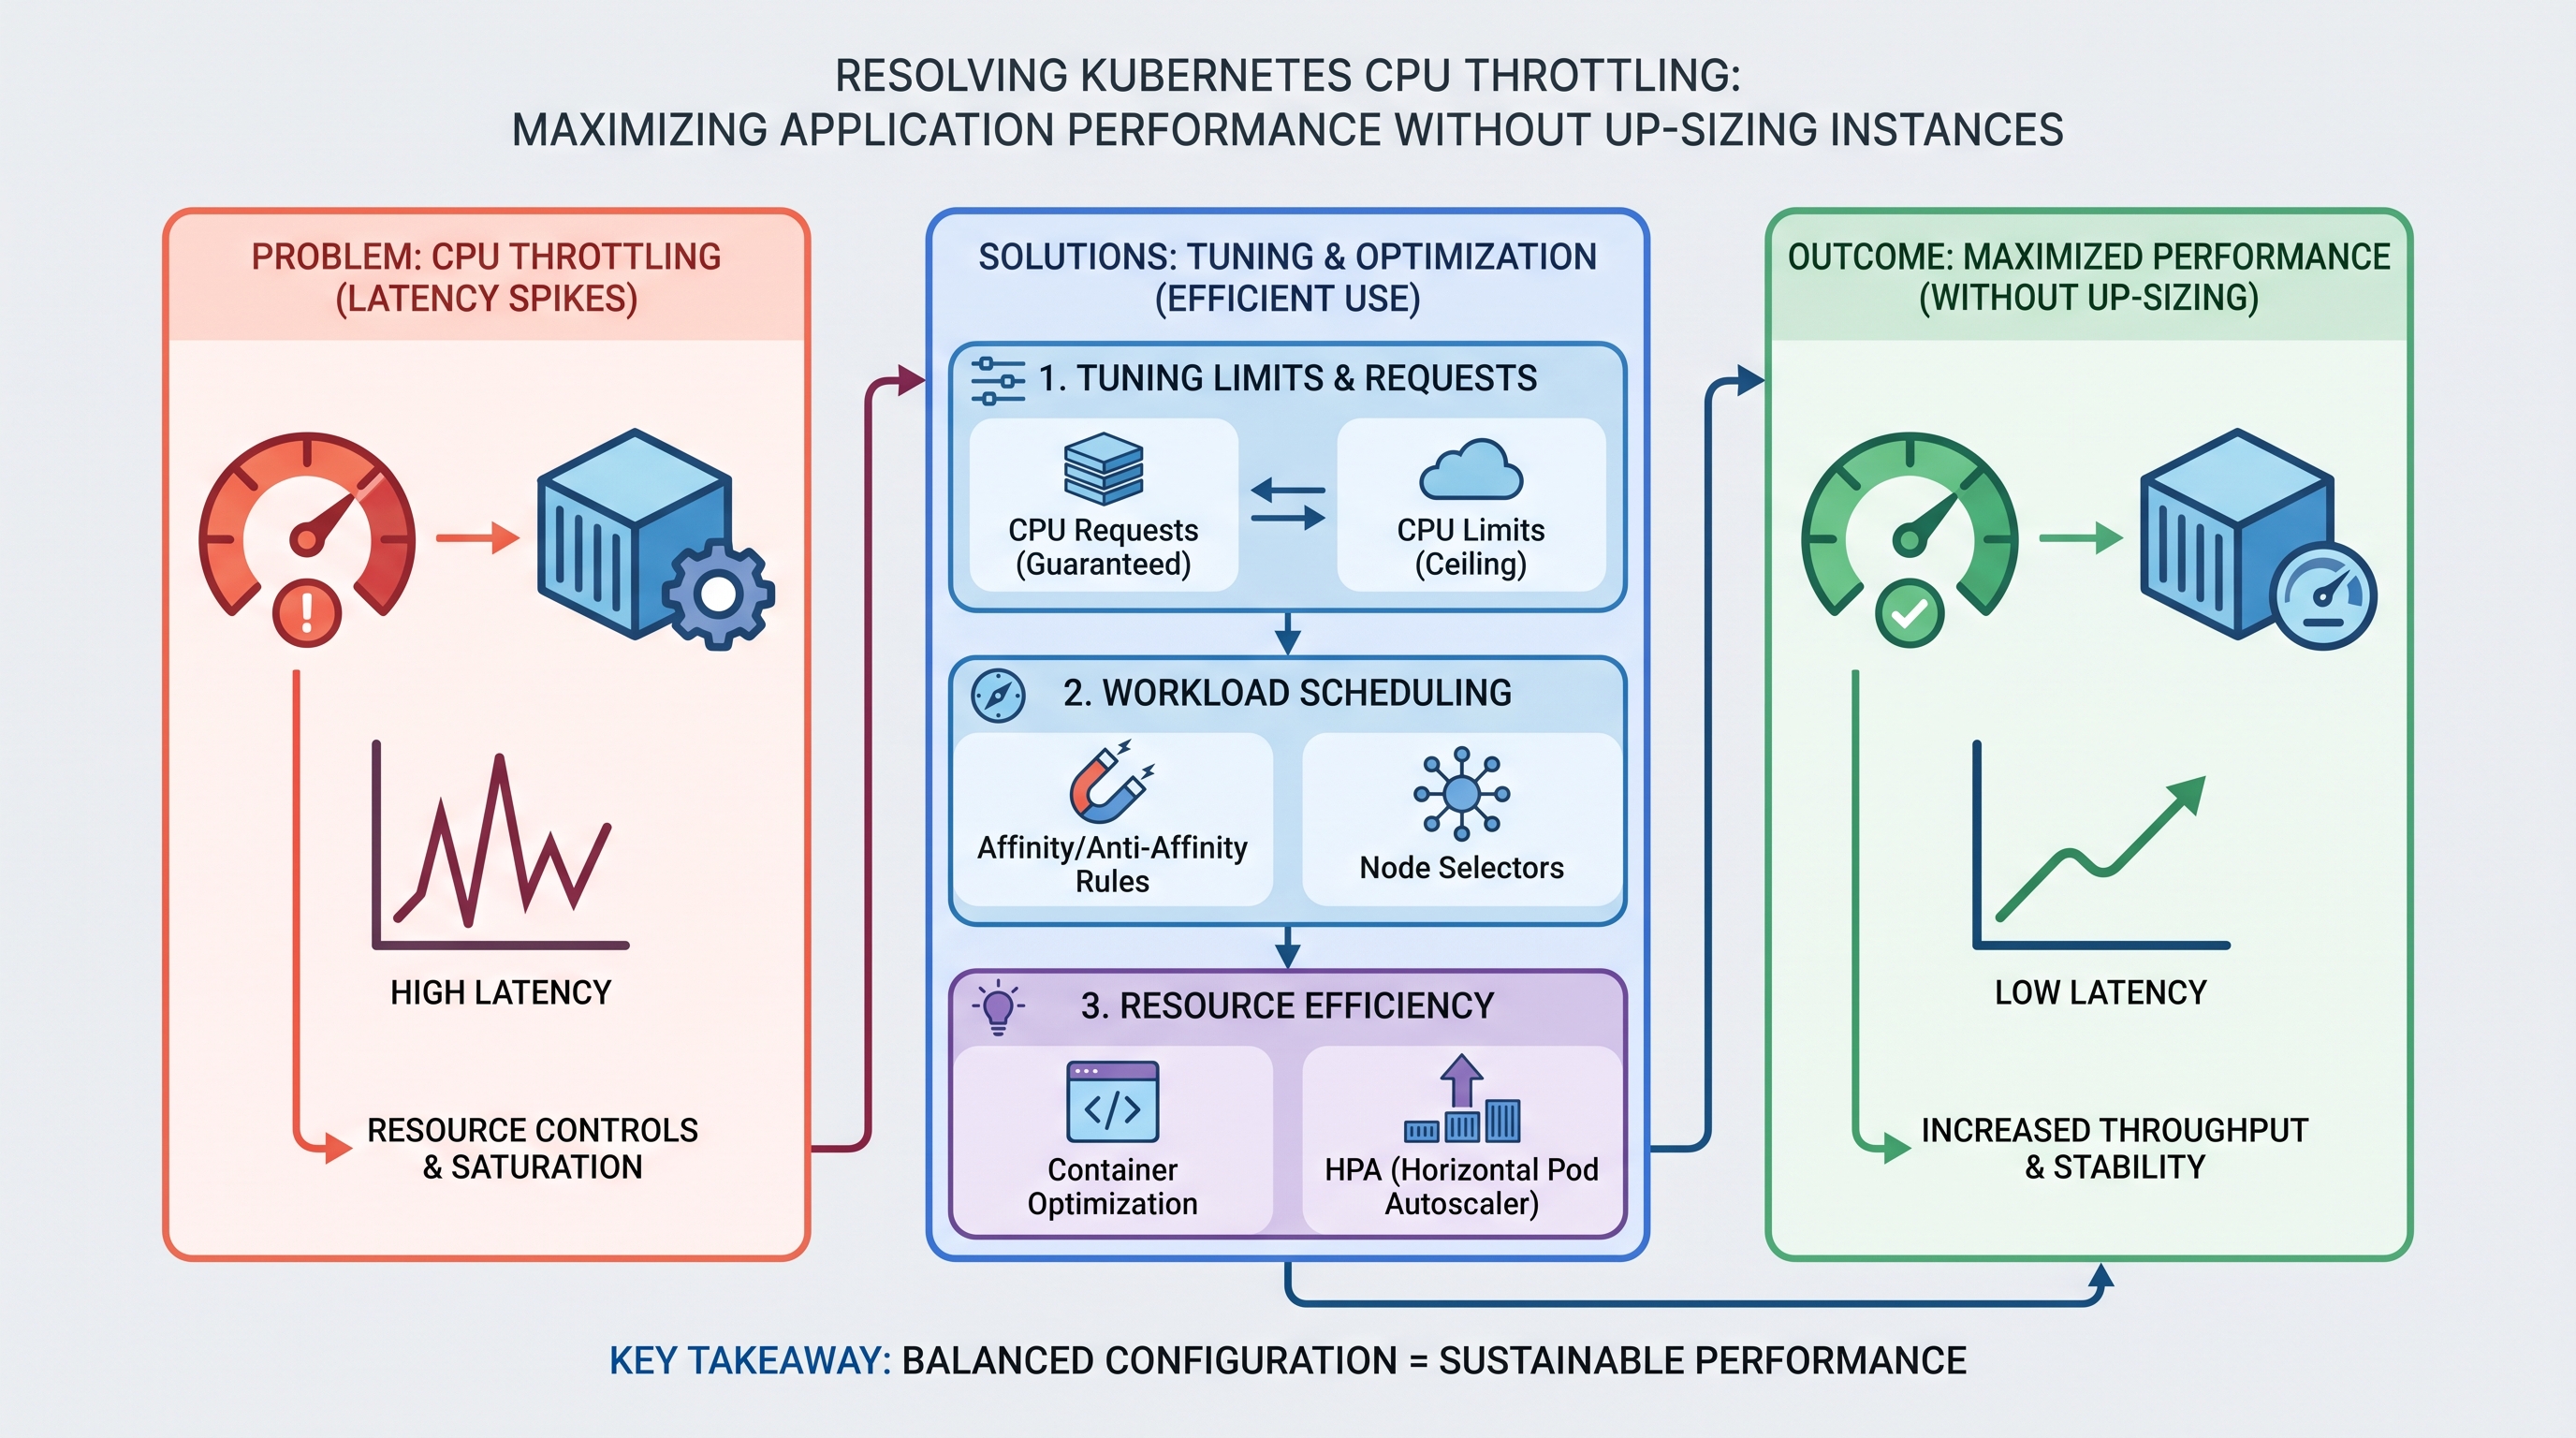
The Silent Performance Killer: Why Low CPU Utilization Still Leads to Throttling
Platform engineers and Site Reliability Engineers (SREs) frequently encounter a frustrating paradox: application latency spikes, HTTP 504 gateway timeouts clog the ingress controller, and Prometheus alerts scream that containers are being heavily throttled. Yet, when inspecting the underlying virtual machine instances (e.g., AWS EC2, Azure VMs, or GCP Compute Engine nodes), the overall CPU utilization sits comfortably below 30%.
The immediate, reactive response is often to modify the Kubernetes Deployment manifest to double the CPU limits, or worse, to scale up the node instance types to larger, more expensive families. In an enterprise environment, this brute-force approach directly violates FinOps principles, driving up cloud waste and eroding operating margins. To solve this problem without spending a single extra dollar on compute resources, we must understand how the Linux kernel enforces resource boundaries in a containerized environment.
In Kubernetes, CPU limits are enforced using the Linux kernel's Completely Fair Scheduler (CFS) bandwidth control mechanism. Unlike CPU requests, which use CFS shares to guarantee resource distribution during contention, CPU limits act as a hard ceiling. This ceiling is enforced over a specific time window, known as the CFS period (typically defaulting to 100 milliseconds). If a container consumes its allocated CPU quota before the period ends, the kernel actively suspends (throttles) the container's processes until the next period begins. This micro-throttling occurs at the millisecond level, making it invisible to traditional 1-minute or even 10-second monitoring metrics, yet highly disruptive to real-time application performance.
Under the Hood: The Mathematics of CFS Bandwidth Control
To systematically eliminate throttling, we must first master the mathematical model of CFS. The kernel uses two primary parameters inside the control groups (cgroups) path for CPU limits:
cpu.cfs_period_us: The duration of the enforcement window, expressed in microseconds (usually 100,000µs or 100ms).cpu.cfs_quota_us: The total run time allowed for all tasks in the cgroup during one period, also expressed in microseconds.
The relationship between your Kubernetes CPU limit (specified in millicores) and the cgroup parameters is defined by the following equation:
cpu.cfs_quota_us = (Kubernetes CPU Limit in millicores / 1000) * cpu.cfs_period_usFor example, if you set a CPU limit of 2000m (2 cores) on a container, the container is allocated 200,000 microseconds of run time within every 100,000-microsecond window.
The Multi-Threaded Concurrency Trap
The mathematical reality of CFS becomes problematic for multi-threaded runtime environments such as Java (JVM), Node.js, Go, or .NET. Consider a Go application running on a large bare-metal or virtualized node with 16 physical cores. The application container is configured with a CPU limit of 2000m (2 cores). By default, the Go runtime detects the 16 physical cores of the host and sets its scheduler threads (GOMAXPROCS) to 16.
When a sudden burst of HTTP requests arrives, the Go runtime schedules tasks across all 16 execution threads simultaneously. The CFS scheduler tracks the cumulative execution time of all threads. The calculation unfolds as follows:
16 active threads * 12.5 milliseconds of execution = 200 milliseconds of total CPU time consumedWithin just 12.5 milliseconds of a 100-millisecond window, the container has completely exhausted its 200,000-microsecond quota. Consequently, the kernel throttles the container for the remaining 87.5 milliseconds of the period. To external monitoring tools averaging CPU over a minute, the container appears to be using a fraction of its capacity, but to the end-user, latency has spiked by nearly 90 milliseconds on a single microservice call. This behavior is illustrated in the table below:
Time Interval (ms) | Active Threads | CPU Time Consumed (ms) | Cumulative Quota Used (ms) | Container State |
|---|---|---|---|---|
0 - 10 | 16 | 160 | 160 / 200 | Running (Active processing) |
10 - 12.5 | 16 | 40 | 200 / 200 | Running (Quota exhausted at 12.5ms) |
12.5 - 100 | 0 | 0 | 200 / 200 | Throttled (All threads suspended by kernel) |
The FinOps Implication: Why Scaling Instances is an Anti-Pattern
When organizations do not understand this micro-throttling behavior, they default to over-provisioning. Upgrading from an AWS m5.xlarge (4 vCPUs, 16 GiB) to an m5.2xlarge (8 vCPUs, 32 GiB) instance type across a cluster of 100 nodes increases compute spend significantly. If your cluster runs 24/7/365, this represents a major financial leak.
By leveraging advanced financial operations platform practices, organizations can analyze the real-world efficiency of their clusters. Up-sizing instances to bypass CFS throttling is a "lazy optimization" that masks architectural issues. It leaves the underlying nodes running at extremely low average utilization (often under 10%), resulting in substantial waste. To achieve true cost efficiency, engineering teams must resolve the root causes of container throttling within the existing resource footprint, utilizing precise performance management capabilities to balance application speed with cloud spend.
Detecting and Measuring CPU Throttling via Prometheus
To solve a problem, you must first measure it. You cannot rely on standard CPU utilization metrics like container_cpu_usage_seconds_total to identify throttling. Instead, you must query the cgroup metrics exposed by the cAdvisor agent embedded within the Kubelet.
The two key metrics for tracking throttling are:
container_cpu_cfs_throttled_periods_total: The cumulative number of periods during which the container was throttled.container_cpu_cfs_periods_total: The total number of elapsed CFS periods.
The Throttling Percentage PromQL Query
To calculate the percentage of time a container is throttled, run the following PromQL query in your Prometheus or Grafana instance:
sum(rate(container_cpu_cfs_throttled_periods_total{container!=""}[5m])) by (namespace, pod, container)
/
sum(rate(container_cpu_cfs_periods_total{container!=""}[5m])) by (namespace, pod, container) * 100
Any container with a throttling percentage greater than 1% to 5% is experiencing performance degradation. If you observe values upwards of 20% to 30%, your application's tail latency (p99) is likely suffering severely.
Additionally, you can measure the exact duration of the throttling using the following query, which returns the average seconds of CPU throttling per second of real time:
sum(rate(container_cpu_cfs_throttled_seconds_total{container!=""}[5m])) by (namespace, pod, container)Four Engineering Strategies to Resolve Throttling Without Up-Sizing
Once you have identified the throttled workloads, you can apply several technical solutions to resolve the issue without increasing your cloud infrastructure footprint.
1. Aligning Application Runtimes with Container Boundaries
The most common cause of self-inflicted throttling is a mismatch between the container's CPU limits and the runtime's thread pool configuration. If your container has a limit of 2 cores, but the runtime spawns 16 threads, you will experience throttling under load.
For Java (JVM) Applications
Older versions of Java (prior to JDK 8u191 and JDK 10) were not container-aware. They read physical host resources from /proc/cpuinfo rather than the cgroup limits in /sys/fs/cgroup. Modern JVMs natively support container resource detection. Ensure your workloads run on JDK 11 or higher and verify that the following flags are active (they are enabled by default):
-XX:+UseContainerSupportYou can also explicitly control the common ForkJoinPool parallelism (used extensively in parallel streams) using:
-XX:ActiveProcessorCount=2For Go Applications
Go runtimes do not automatically respect cgroup limits, which can lead to excessive thread creation. To fix this, import the uber-go/automaxprocs library into your main package. This library automatically parses the container's cgroup limits and configures GOMAXPROCS to match the fractional or integer CPU limit specified in your deployment manifest:
import _ "usr.go.uber.org/automaxprocs"For Node.js Applications
Node.js is single-threaded by nature, but its underlying dependency, libuv, uses a thread pool for asynchronous I/O operations (such as file system access or cryptographic tasks). By default, UV_THREADPOOL_SIZE is set to 4. If your container has a limit of less than 1 core (e.g., 500m), these threads can trigger throttling. Align this variable with your container's CPU allocation in your Pod specification:
env:
  - name: UV_THREADPOOL_SIZE
    value: "2"
2. Implementing the Kubernetes CPU Manager (Static Policy)
For highly latency-sensitive workloads, such as real-time payment processing, ad-tech bidding engines, or high-throughput telemetric ingestion, the dynamic scheduling of CFS is sometimes insufficient. For these scenarios, you can configure the Kubelet to use the Static CPU Manager Policy.
The CPU Manager allows containers in the Guaranteed Quality of Service (QoS) class with integer CPU requests to be granted exclusive access to specific physical CPU cores on the host node. This bypasses the CFS quota sharing mechanism entirely for those cores, eliminating throttling and context-switching overhead.
How to Enable the Static Policy
First, the Kubelet on your worker nodes must be configured with the static policy. This is typically done via the Kubelet configuration file or bootstrap arguments:
--cpu-manager-policy=staticConfiguring the Workload for Exclusive Cores
To qualify for exclusive CPU pinning, your Pod must meet the requirements of the Guaranteed QoS class:
The CPU request and limit must be identical.
The memory request and limit must be identical.
The CPU values must be integers (e.g.,
2,4, or8, not2500mor1.5).
Here is an example of a Guaranteed QoS Pod spec designed for exclusive CPU allocation:
apiVersion: apps/v1
kind: Deployment
metadata:
  name: latency-critical-app
  namespace: production
spec:
  replicas: 3
  template:
    metadata:
      labels:
        app: latency-critical-app
    spec:
      containers:
      - name: engine
        image: internal-registry.corp/engine:v2.1.0
        resources:
          requests:
            cpu: "4"
            memory: "8Gi"
          limits:
            cpu: "4"
            memory: "8Gi"
When this Pod is scheduled, the Kubelet's CPU Manager writes to the cpuset cgroup of the container, assigning it four specific physical CPU threads. No other containers on that node will be scheduled on those cores, eliminating CFS throttling and context-switching latency.
3. The "No Limits" Architecture and Its Security implications
A growing school of thought within the Kubernetes community advocates for removing CPU limits entirely. In this model, you configure containers with CPU requests (to guarantee scheduling and resource availability during contention) but omit the resources.limits.cpu field.
When you omit CPU limits, the container's processes are allowed to consume as much spare CPU on the host node as is available. This completely eliminates CFS throttling, as the cgroup quota parameters are never set. However, this strategy introduces operational and security risks that must be carefully managed.
The Noisy Neighbor Vulnerability
Without CPU limits, a single misbehaved container—such as an application with an infinite loop bug or a thread leak—can consume 100% of the host node's CPU capacity. While Kubernetes uses system-reserved allocations to protect critical system daemons (like the Kubelet, container runtime, and SSH), other co-located application pods on the same node may experience resource starvation, leading to cascading performance degradation across your cluster.
Security and Cryptojacking Risks
From a security perspective, omitting CPU limits exposes your cluster to severe exploitation risks. If a container is compromised via a remote code execution (RCE) vulnerability, attackers often deploy cryptojacking malware to mine cryptocurrency. Without CPU limits, the malicious process will consume all available CPU capacity across your worker nodes, driving up cloud costs and degrading legitimate workloads.
To safely adopt a "No Limits" or "High Limits" model, you must implement strong guardrails. Using tools like infrastructure and SRE solutions, you can establish automated monitoring and alerting configurations to detect anomalous CPU usage patterns. This ensures that when a container behaves unexpectedly, your operations team is alerted before it impacts your cloud budget or cluster stability.
Implementing LimitRanges as a Cluster Guardrail
To prevent developers from accidentally deploying pods without any boundaries, you can enforce default limits at the namespace level using a LimitRange resource. This ensures that even if a manifest lacks a limit block, Kubernetes will apply a safe default:
apiVersion: v1
kind: LimitRange
metadata:
  name: default-cpu-limits
  namespace: production
spec:
  limits:
  - default:
      cpu: "2000m"
      memory: "4Gi"
    defaultRequest:
      cpu: "500m"
      memory: "1Gi"
    type: Container
4. Upgrading Kernels to Resolve the CFS Quota Bug
If your organization runs older Linux distributions, you may be experiencing a known Linux kernel bug that causes excessive and artificial CPU throttling. Historically, the kernel's CFS quota mechanism suffered from a bug where runtime quotas were not properly reset at the end of a period, leaving containers throttled even when they had consumed a fraction of their allocated CPU.
This bug was addressed in the upstream Linux kernel in 2019 and has been backported to major enterprise distributions. To determine if you are affected, check your node operating system and kernel versions. The fix is included in:
Linux Kernel versions 5.14 and above.
Backported to kernel 4.19.119+ and 5.4.30+.
Red Hat Enterprise Linux (RHEL) 8.2+ and CentOS 8.2+.
If your worker nodes run older kernels, upgrading your node machine images (AMIs, VM images) to a modern kernel version can resolve a significant portion of your CPU throttling issues without requiring any changes to your application code or resource limits.
Strategic Resource Allocation: Finding the Sweet Spot
Resolving CPU throttling is not just about removing limits; it is about finding the right balance between performance, cost, and reliability. This requires a systematic approach to resource sizing:
The Resource Sizing Workflow
Establish a Performance Baseline: Run your workloads under realistic load tests without CPU limits to observe their natural CPU consumption patterns.
Analyze p99 Latency: Identify the correlation between CPU utilization spikes and response time degradation.
Set Requests Based on Average Load: Configure your CPU requests to match the 85th percentile of your workload's normal operating usage. This ensures efficient scheduling without over-provisioning.
Set Limits Based on Peak Bursts: Configure your CPU limits to accommodate short-lived processing bursts, or utilize modern kernels and runtime thread-matching to minimize CFS penalties.
By implementing this workflow, you can safely run workloads at higher densities on your existing nodes, avoiding the need to purchase additional compute capacity. This structured approach to resource management is a core component of a modern financial operations platform strategy.
Unifying Performance, FinOps, and Security with CloudAtler
Manually tuning CFS periods, tracking down micro-throttling across thousands of containers, and configuring CPU managers on individual node groups is a complex, time-consuming process. In large, multi-cloud enterprise environments, keeping track of these adjustments manually is rarely scalable.
This is where CloudAtler can help. As an AI-powered platform, CloudAtler unifies FinOps, cloud security, and automated operations across AWS, Azure, GCP, and Oracle environments. Instead of relying on manual intervention to fix performance issues, CloudAtler's Atler AI continuously analyzes your Kubernetes clusters to find the optimal balance between cost and performance.
By leveraging CloudAtler's predictive monitoring and operations capabilities, you can:
Automate Workload Sizing: Automatically adjust CPU requests and limits based on historical utilization and throttling patterns, eliminating waste without risking performance.
Enforce Security Guardrails: Maintain visibility into your workloads to prevent resource exhaustion and protect against unauthorized cryptojacking attempts.
Bridge the Gap Between SRE and Finance: Translate technical performance improvements directly into financial metrics, showing how tuning your resources reduces your monthly cloud spend.
Don't let CPU throttling degrade your application performance or inflate your cloud budget. Take control of your Kubernetes clusters with an intelligent, automated platform designed for modern cloud operations.
All in One Place
Atler Pilot decodes your cloud spend story by bringing monitoring, automation, and intelligent insights together for faster and better cloud operations.