
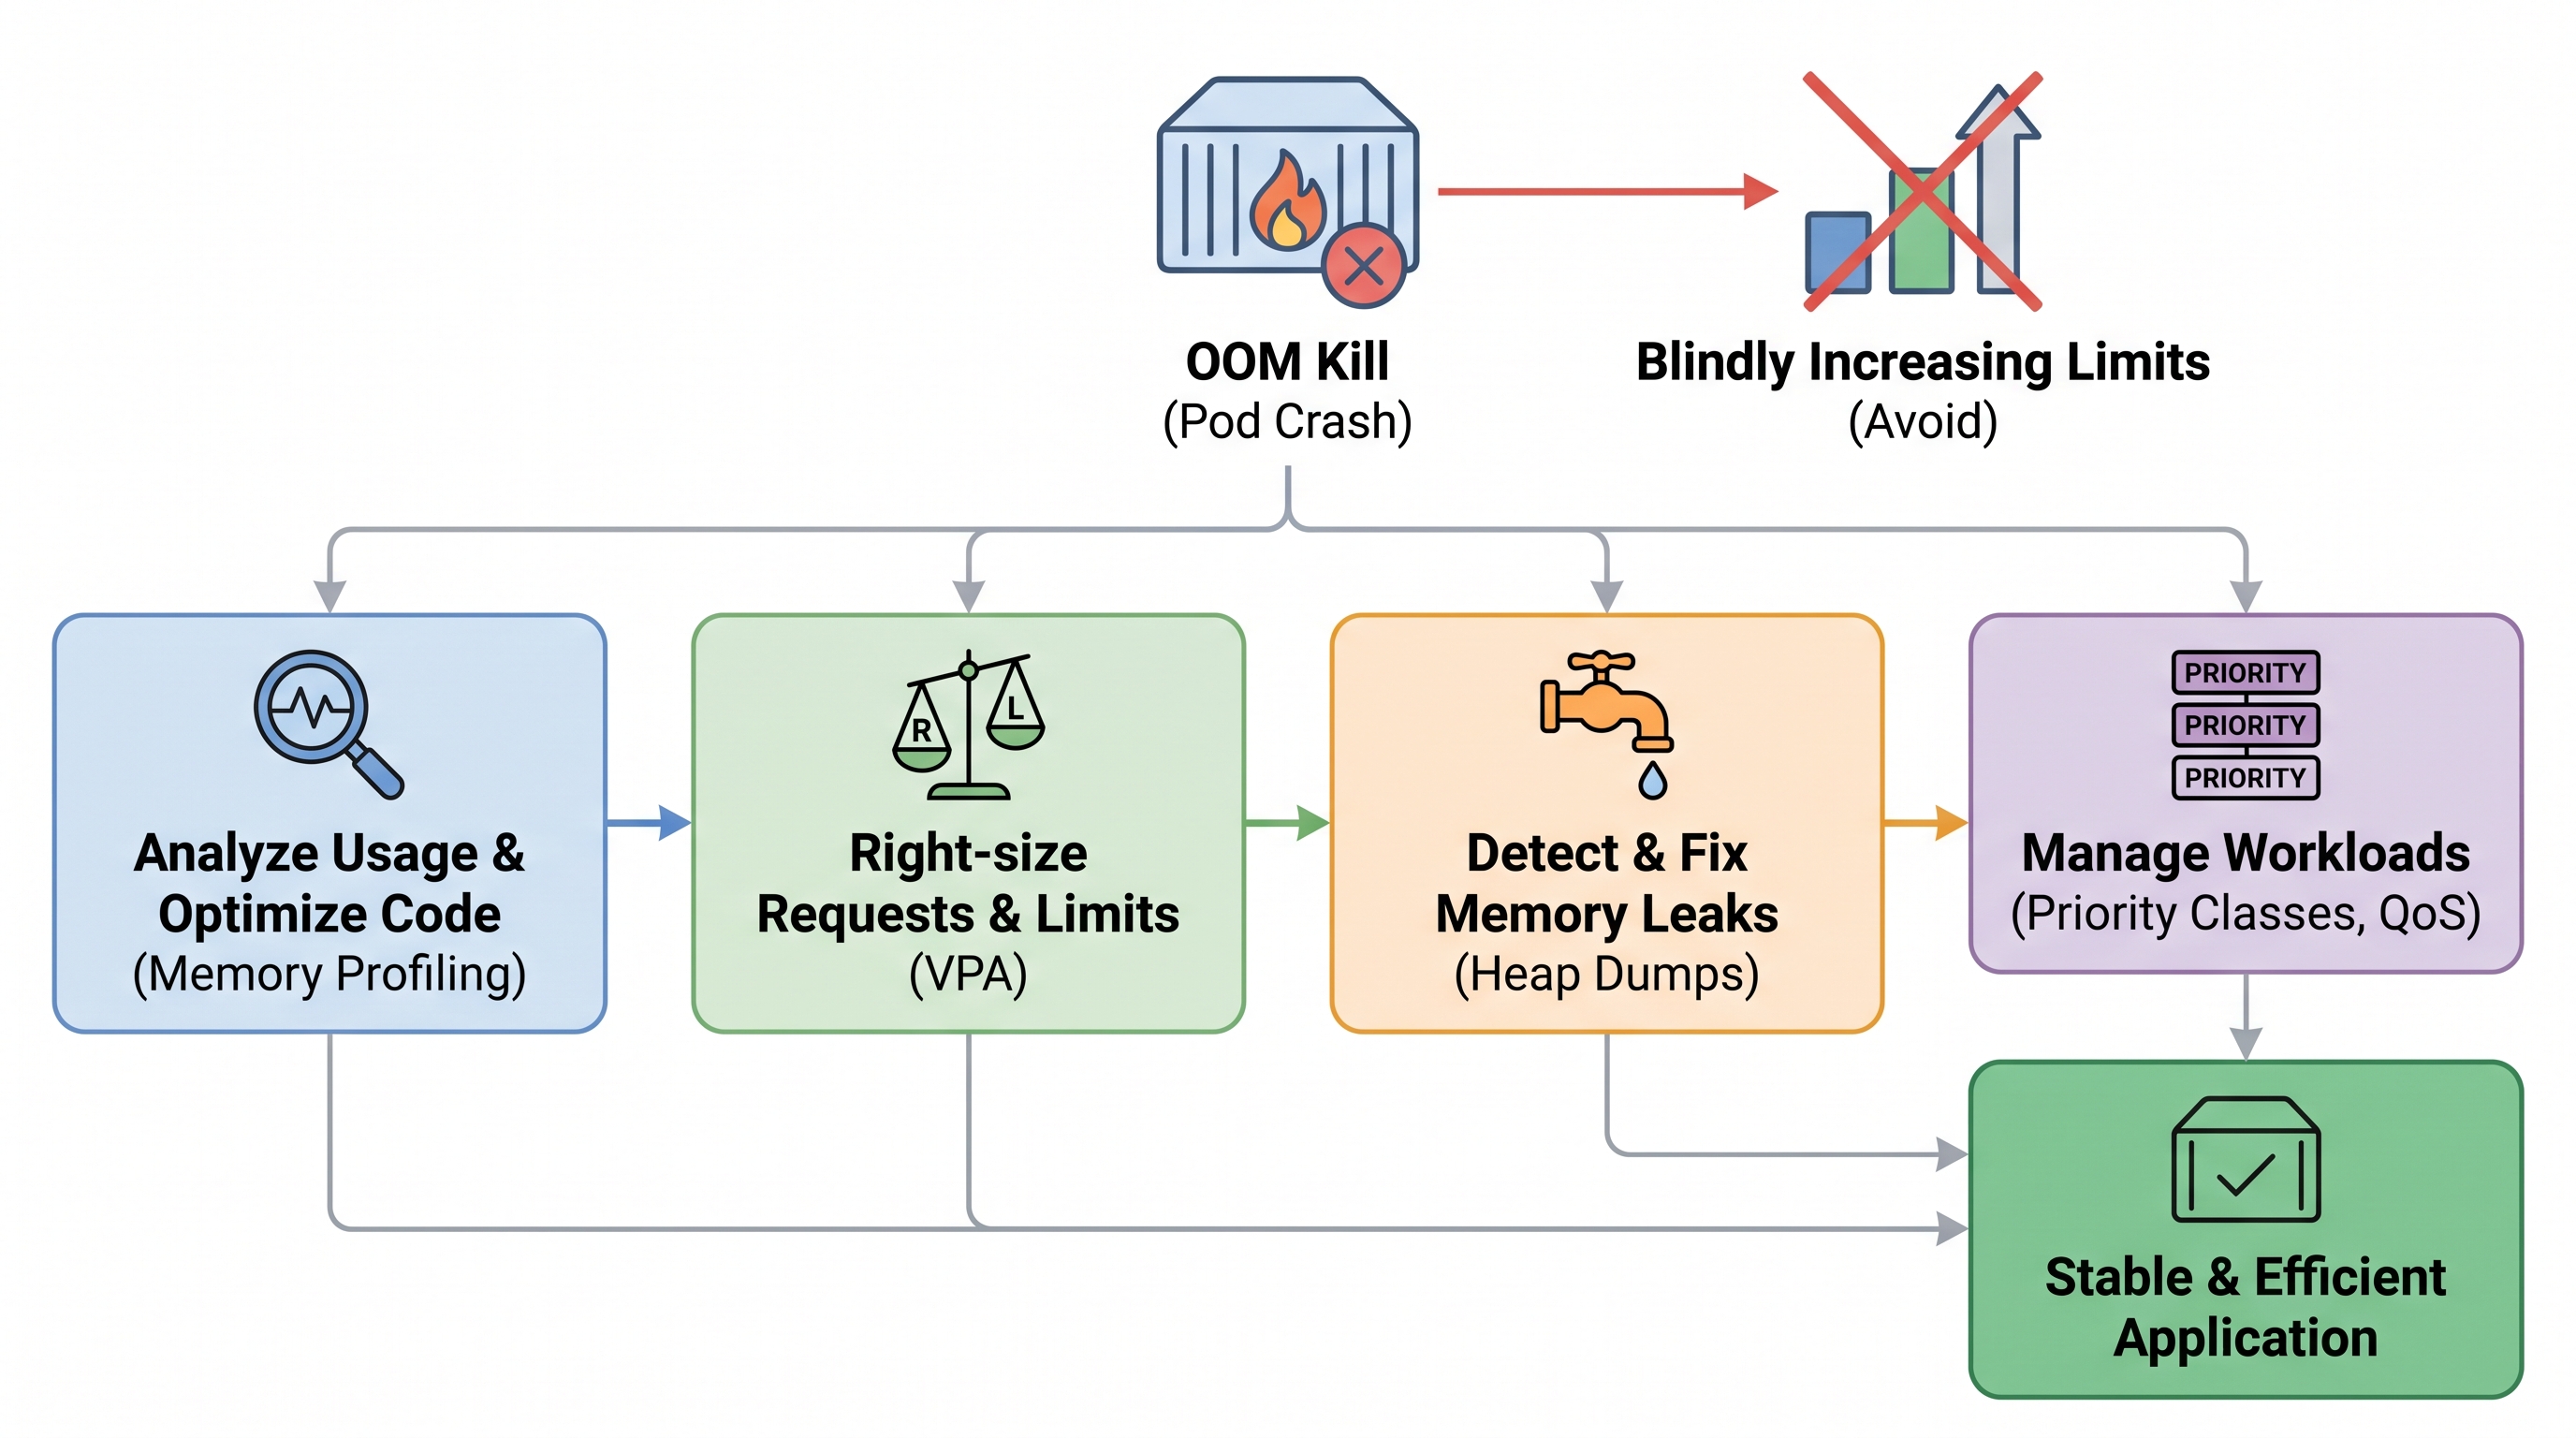
The Cost of the Quick Fix: Why "Double the Limits" is a FinOps Disaster
It is a scenario familiar to every site reliability engineer (SRE) and cloud architect: a critical production microservice suddenly drops, throwing an OOMKilled status with Exit Code 137. The immediate pressure to restore service availability often leads to a quick, brute-force mitigation—doubling the memory limit in the deployment's Helm chart or Kubernetes manifest. While this temporary fix may quiet the alerting system, it introduces a insidious architectural anti-pattern that directly undermines both enterprise financial operations (FinOps) and cluster scheduling efficiency.
When you blindly increase memory limits to bypass OOM kills, you create massive gaps of "slack space"—the difference between the allocated memory limit and the actual memory utilized by the application under normal operating conditions. In multi-tenant enterprise clusters, this over-provisioning quickly aggregates. If hundreds of microservices are allocated 4 GB of memory limits but run at an average utilization of only 300 MB, the Kubernetes scheduler must still respect those resource declarations when placing pods. This results in artificial resource starvation, premature node scaling, and heavily inflated cloud bills across AWS, Azure, GCP, or on-premises infrastructure.
To build resilient, cost-effective infrastructure, organizations must move away from reactive resource inflation. Instead, they need to adopt a systematic, data-driven approach to memory management. By leveraging a comprehensive financial operations platform alongside deep runtime diagnostics, engineering teams can resolve the root causes of memory exhaustion while maintaining tight control over cloud spend.
The Anatomy of a Kubernetes OOM Kill
To effectively remediate OOM kills, we must first understand the underlying operating system and container runtime mechanics that trigger them. An OOM kill is not a native Kubernetes event; rather, it is a protective action executed by the Linux kernel's Out-of-Memory Killer (OOM Killer) or enforced by control groups (cgroups).
Control Groups (cgroups) v1 vs. v2
Kubernetes relies on Linux cgroups to isolate and limit resource usage for containers. When a container runtime (such as containerd or CRI-O) spins up a pod, it configures the corresponding cgroup path with the memory limits defined in the pod specification:
cgroups v1: Memory limits are enforced via parameters like
memory.limit_in_bytesand monitored viamemory.usage_in_bytes. The memory controller tracks anonymous memory, swap, and page caches separately.cgroups v2: Introduces a unified hierarchy. Memory limits are defined using
memory.max(hard limit) andmemory.high(throttling threshold). cgroups v2 provides more accurate accounting of page cache writebacks and memory pressure events, allowing the kernel to manage memory reclamation more gracefully before terminating processes.
How the Linux Kernel and Kubelet Interact
There are two distinct pathways through which a pod can be terminated due to memory exhaustion: Container-level OOM and Node-level OOM.
Attribute | Container-Level OOM Kill | Node-Level OOM Kill / Eviction |
|---|---|---|
Triggering Mechanism | Container memory usage exceeds the defined cgroup limit ( | The host node runs out of physical memory, threatening system stability. |
Enforcing Agent | Linux kernel OOM Killer targeting the specific cgroup. | The |
Kubernetes Status |
|
|
Impact on Node | Isolated to the container. No impact on other pods on the same node. | Can cause node instability, affecting multiple workloads and daemonsets. |
In a container-level OOM scenario, the container's processes exceed the cgroup limit. The kernel identifies the offending cgroup, selects the process with the highest oom_score within that cgroup, and terminates it with a SIGKILL signal. The kubelet detects this termination, updates the pod status to OOMKilled, and applies the configured restart policy.
In contrast, a node-level OOM occurs when the total memory consumption of all running pods, the operating system, and system daemons approaches 100% of the physical RAM. The kubelet constantly monitors node memory usage. If memory falls below the memory.available eviction threshold (typically 100Mi by default), the kubelet attempts to reclaim memory by evicting pods based on their Quality of Service (QoS) class and memory utilization relative to requests. If the exhaustion happens too rapidly for the kubelet to react, the host kernel's OOM Killer will step in, selecting processes to kill based on global oom_score_adj values assigned by the kubelet.
Deconstructing the QoS Classes and oom_score_adj
The Kubernetes scheduler and the Linux kernel coordinate process priority during resource crunches using Quality of Service (QoS) classes. The kubelet assigns an oom_score_adj (OOM score adjustment) value to every container based on its resource requests and limits. The kernel uses this adjustment to calculate the final oom_score; processes with higher scores are terminated first during memory pressure.
1. Guaranteed QoS Class
A pod is classified as Guaranteed if every container in the pod has both memory and CPU requests and limits explicitly defined, and those requests are exactly equal to the limits.
apiVersion: v1
kind: Pod
metadata:
  name: guaranteed-service
spec:
  containers:
  - name: app
    image: enterprise-app:v1.2.0
    resources:
      limits:
        cpu: "2"
        memory: "2Gi"
      requests:
        cpu: "2"
        memory: "2Gi"
The kubelet configures Guaranteed pods with an oom_score_adj of -997. This makes them highly resilient to node-level OOM kills; they are the last workloads the kernel will target, only terminated if system-critical daemons or the kubelet itself are at risk.
2. Burstable QoS Class
A pod is classified as Burstable if it does not meet the criteria for Guaranteed, but at least one container has a memory or CPU request defined. This is the most common configuration in enterprise clusters.
apiVersion: v1
kind: Pod
metadata:
  name: burstable-service
spec:
  containers:
  - name: app
    image: enterprise-app:v1.2.0
    resources:
      limits:
        memory: "4Gi"
      requests:
        memory: "1Gi"
The kubelet calculates the oom_score_adj for Burstable pods dynamically based on the percentage of the node's total memory requested by the container. The formula is:
$\text{oom\_score\_adj} = 1000 - \left( 1000 \times \frac{\text{memoryRequestBytes}}{\text{nodeTotalMemoryBytes}} \right)$
This adjustment ensures that Burstable pods that request a larger share of node capacity have a lower OOM score adjustment, protecting them over pods that request very little but consume massive amounts of burst memory.
3. BestEffort QoS Class
A pod is classified as BestEffort if none of its containers have any resource requests or limits defined.
The kubelet assigns BestEffort pods an oom_score_adj of 1000. In the event of any node-level memory pressure, these pods are immediately targeted for termination. Running production workloads in BestEffort pods is an operational anti-pattern that exposes applications to extreme volatility.
Systematically Diagnosing the Root Cause of Memory Growth
Before modifying any Kubernetes manifests, SRE and platform engineering teams must diagnose why the container is consuming memory. Memory growth typically falls into one of three categories: Memory Leaks, Peak Load Spikes, or Memory Bloat.
Differentiating Leak vs. Peak vs. Bloat
Memory Leaks: A continuous, monotonic increase in memory usage over time. Memory is allocated but never released back to the operating system or runtime garbage collector. The application will eventually OOM regardless of how high the limit is set.
Peak Load Spikes: Memory usage spikes sharply during specific events, such as processing large batch jobs, handling high-concurrency API traffic, or performing in-memory database operations. Once the event completes, memory usage stabilizes or drops.
Memory Bloat: The application has a high baseline memory footprint due to inefficient dependency loading, oversized in-memory caches, or unoptimized runtime configurations.
Extracting Diagnostics with Prometheus and kubectl
To identify the pattern of memory growth, analyze historical metrics. The most critical metric to monitor is container_memory_working_set_bytes, which is the metric the kubelet uses to make OOM and eviction decisions. Do not rely solely on container_memory_rss, as it excludes cached memory that cannot be easily freed under pressure.
Execute the following Prometheus Query (PromQL) to identify pods approaching their memory limits:
sum(container_memory_working_set_bytes{container!=""}) by (pod, namespace)
/
sum(container_spec_memory_limit_bytes{container!=""}) by (pod, namespace) * 100
To view detailed container status and exit codes directly from the Kubernetes API, use:
kubectl get pods -n <namespace> -o jsonpath='{range .items[*]}{.metadata.name}{"\t"}{.status.containerStatuses[*].lastState.terminated.reason}{"\tExitCode:"}{.status.containerStatuses[*].lastState.terminated.exitCode}{"\n"}{end}'If the output reveals OOMKilled with ExitCode:137, you have definitive proof of cgroup-enforced termination.
Runtime-Specific Memory Tuning
Modern application runtimes do not inherently understand cgroup boundaries. Unless configured otherwise, runtimes like the Java Virtual Machine (JVM), Node.js, and Python may look at the host node's physical memory rather than the container's cgroup limits, leading to catastrophic misallocations.
1. Java Virtual Machine (JVM) Tuning
Historically, the JVM read physical host memory via /proc/meminfo, causing it to set heap sizes far exceeding container limits. While modern JVMs (Java 10+) are container-aware, they still require explicit configuration to prevent OOM kills.
By default, the JVM sets the Maximum Heap Size (MaxRAMPercentage) to 25% of the container's memory limit. This is highly conservative and often prompts developers to increase container limits. To optimize this, explicitly configure the JVM using container-aware flags in your deployment environment variables:
env:
  - name: JAVA_TOOL_OPTIONS
    value: "-XX:InitialRAMPercentage=50.0 -XX:MaxRAMPercentage=75.0 -XX:+UseG1GC"
Setting MaxRAMPercentage to 75% allocates 75% of the container's cgroup limit to the JVM heap, leaving 25% for off-heap memory (Metaspace, thread stacks, direct byte buffers, and native OS overhead). This prevents the JVM from exceeding the container's hard limit while maximizing memory utility.
2. Go Runtime (Golang) Tuning
Go is known for its fast execution and small footprint, but its garbage collector (GC) can be aggressive or lazy depending on allocation patterns. Prior to Go 1.19, the runtime was unaware of container memory limits, often leading to OOM kills during rapid allocations because the GC did not trigger in time.
Go 1.19 introduced the GOMEMLIMIT environment variable. This flag acts as a soft limit that the Go runtime will actively respect by running garbage collection more aggressively as memory usage approaches the threshold.
env:
  - name: GOMEMLIMIT
    value: "900MiB" # Set slightly below the container's memory request/limit
By setting GOMEMLIMIT to approximately 90% of your container's memory limit, you ensure the Go garbage collector runs to reclaim memory before the Linux kernel cgroup controller steps in to terminate the container.
3. Node.js (V8 Engine) Tuning
Node.js limits the heap size of the V8 engine to a default of approximately 1.4 GB on 64-bit systems, regardless of whether it is running on a 16 GB node or a 512 MB container. If your container limit is set to 1 GB, Node.js will happily attempt to allocate up to 1.4 GB, resulting in an immediate OOM kill.
To align the V8 heap with your container boundaries, configure the --max-old-space-size flag via the NODE_OPTIONS environment variable:
env:
  - name: NODE_OPTIONS
    value: "--max-old-space-size=768" # Configured in megabytes
Ensure that max-old-space-size is set to roughly 75-80% of the container's total memory limit to account for non-heap allocations, native modules, and buffer allocations.
Architectural Strategies to Mitigate OOM Without Resource Inflation
Resolving OOM kills sustainably requires implementing architectural patterns that build resilience into your microservices and cluster configurations. Applying robust infrastructure and SRE solutions ensures that your services gracefully handle load spikes without crashing.
1. Implementing Backpressure and Rate Limiting
When downstream services slow down, upstream services often buffer incoming requests in memory, leading to memory exhaustion. To prevent this, services must implement backpressure mechanisms:
Bounded Queues: Never use unbounded in-memory queues. Ensure all request queues, event buffers, and channel allocations have strict upper bounds. When a queue is full, reject incoming requests with an HTTP 429 (Too Many Requests) or drop them gracefully.
Circuit Breakers: Use service meshes (like Istio or Linkerd) or application libraries (like Resilience4j) to fail fast when downstream dependencies are unhealthy, preventing memory-intensive request buffering.
2. Leveraging the Vertical Pod Autoscaler (VPA) in Auto Mode Safely
The Horizontal Pod Autoscaler (HPA) is highly effective for scaling CPU-bound workloads, but memory-bound workloads often do not scale horizontally to relieve memory pressure. If a pod has a memory leak or is processing a massive dataset, spinning up more replicas will simply result in more OOM-killed pods.
The Vertical Pod Autoscaler (VPA) solves this by dynamically adjusting the memory requests and limits of your pods based on historical usage metrics. However, running VPA in Auto mode can cause disruptions because updating resource definitions requires restarting the pod. To implement VPA safely:
Use VPA in
Recommendermode first to analyze usage and generate recommendations without applying changes.Enable VPA in
Automode only in non-production environments to validate stability.For production, pair VPA with budget constraints and disruption budgets to ensure a minimum number of replicas remain available during adjustments.
apiVersion: autoscaling.k8s.io/v1
kind: VerticalPodAutoscaler
metadata:
  name: billing-service-vpa
spec:
  targetRef:
    apiVersion: "apps/v1"
    kind: Deployment
    name: billing-service
  updatePolicy:
    updateMode: "Auto"
  resourcePolicy:
    containerPolicies:
      - containerName: '*'
        minAllowed:
          cpu: "100m"
          memory: "256Mi"
        maxAllowed:
          cpu: "2"
          memory: "4Gi"
        controlledResources: ["cpu", "memory"]
3. Continuous Performance Management and Profiling
To identify the exact lines of code or dependencies causing memory leaks and bloat, SREs should integrate continuous profiling tools into their pipelines. Tools like pprof (Go), async-profiler (Java), and py-spy (Python) can run in production with minimal overhead, generating flame graphs that pinpoint heap allocations.
By combining continuous profiling with proactive performance management and optimization, teams can identify memory regressions during CI/CD stages before they ever reach production and trigger OOM alerts.
FinOps and Security Alignment: Governance at Scale
Managing resource limits is not just an engineering convenience; it is a core pillar of cloud security and financial governance. Uncontrolled resource allocation exposes clusters to significant risks.
The Security Risk of Over-Provisioned Containers
From a security perspective, over-provisioned containers present an expanded attack surface. In the event of a Denial of Service (DoS) attack, an application with excessively high memory limits will continue to consume node resources, potentially starving adjacent, critical system pods before the cgroup controller intervenes. Attackers can exploit memory-intensive operations to execute resource exhaustion attacks, degrading the performance of the entire cluster.
Furthermore, implementing strict operational guardrails ensures that namespaces have enforced LimitRanges and ResourceQuotas. This prevents developers from deploying manifests with missing or unreasonably high limits, protecting multi-tenant environments from noisy-neighbor scenarios.
Establishing Guardrails with LimitRanges
To enforce memory discipline across engineering teams, platform operators should configure LimitRanges within every Kubernetes namespace. A LimitRange defines default, minimum, and maximum resource limits that are automatically applied to containers upon creation if not explicitly declared.
apiVersion: v1
kind: LimitRange
metadata:
  name: core-limits
  namespace: payment-processing
spec:
  limits:
  - default:
      memory: "1Gi"
      cpu: "500m"
    defaultRequest:
      memory: "512Mi"
      cpu: "200m"
    max:
      memory: "4Gi"
      cpu: "2"
    min:
      memory: "128Mi"
      cpu: "100m"
    type: Container
By enforcing a maximum memory limit of 4 GiB at the namespace level, the platform team prevents any individual deployment from requesting excessive node memory, containing potential memory leaks or misconfigurations within safe boundaries.
How CloudAtler Unifies Performance, FinOps, and Security
Manually diagnosing OOM kills, calculating optimal JVM/Go runtime variables, adjusting cgroup allocations, and tracking down memory leaks across thousands of microservices is an overwhelming task for enterprise teams. This fragmented approach often leads to tool fatigue, misaligned priorities between SREs and finance teams, and persistent operational instability.
CloudAtler solves this challenge by providing an AI-driven, unified platform that integrates FinOps, cloud security, and automated operations. Instead of treating OOM kills as isolated infrastructure alerts, CloudAtler's predictive monitoring and operations engine correlates container restarts with real-time cloud spend, application performance profiles, and security posture metrics.
The CloudAtler Advantage:
Automated Resource Optimization: CloudAtler analyzes historical memory utilization patterns, distinguishing between actual memory spikes and slow memory leaks. It automatically recommends or executes precise adjustments to requests and limits, eliminating slack space without risking application stability.
Runtime-Aware Intelligence: The platform understands the runtimes inside your containers, providing automated suggestions for environment variables like
GOMEMLIMITorMaxRAMPercentagebased on the allocated cgroup boundaries.Financial Impact Calculation: Every OOM remediation is mapped directly to cost savings, showing SREs and finance leaders exactly how much waste was eliminated by rightsizing workloads instead of blindly inflating limits.
Security Guardrail Enforcement: CloudAtler continuously scans your cluster configurations to ensure namespaces are protected by appropriate resource quotas and limit ranges, preventing resource exhaustion attacks and ensuring compliance with enterprise security frameworks.
Conclusion: Stop Guessing, Start Optimizing
Kubernetes Out-of-Memory kills are a clear signal that an application's resource demands are misaligned with its operational environment. Treating this symptom by simply increasing memory limits is an expensive, temporary fix that compromises cluster efficiency, inflates cloud budgets, and introduces security vulnerabilities.
By systematically analyzing cgroups behavior, configuring container-aware runtimes, implementing architectural resilience patterns, and enforcing namespace guardrails, you can build a stable, highly optimized Kubernetes infrastructure. This disciplined approach ensures your applications have the exact resources they need to perform reliably, without wasting a single dollar of cloud spend.
Ready to move beyond reactive troubleshooting? Stop guessing your resource limits and start managing your multi-cloud environments with absolute precision. Unify your cloud operations with CloudAtler today and experience the power of AI-driven FinOps, security, and performance management across AWS, Azure, GCP, and Oracle environments. Schedule a demo or explore our platforms to transform your cloud governance.
All in One Place
Atler Pilot decodes your cloud spend story by bringing monitoring, automation, and intelligent insights together for faster and better cloud operations.