
1. Executive Synthesis
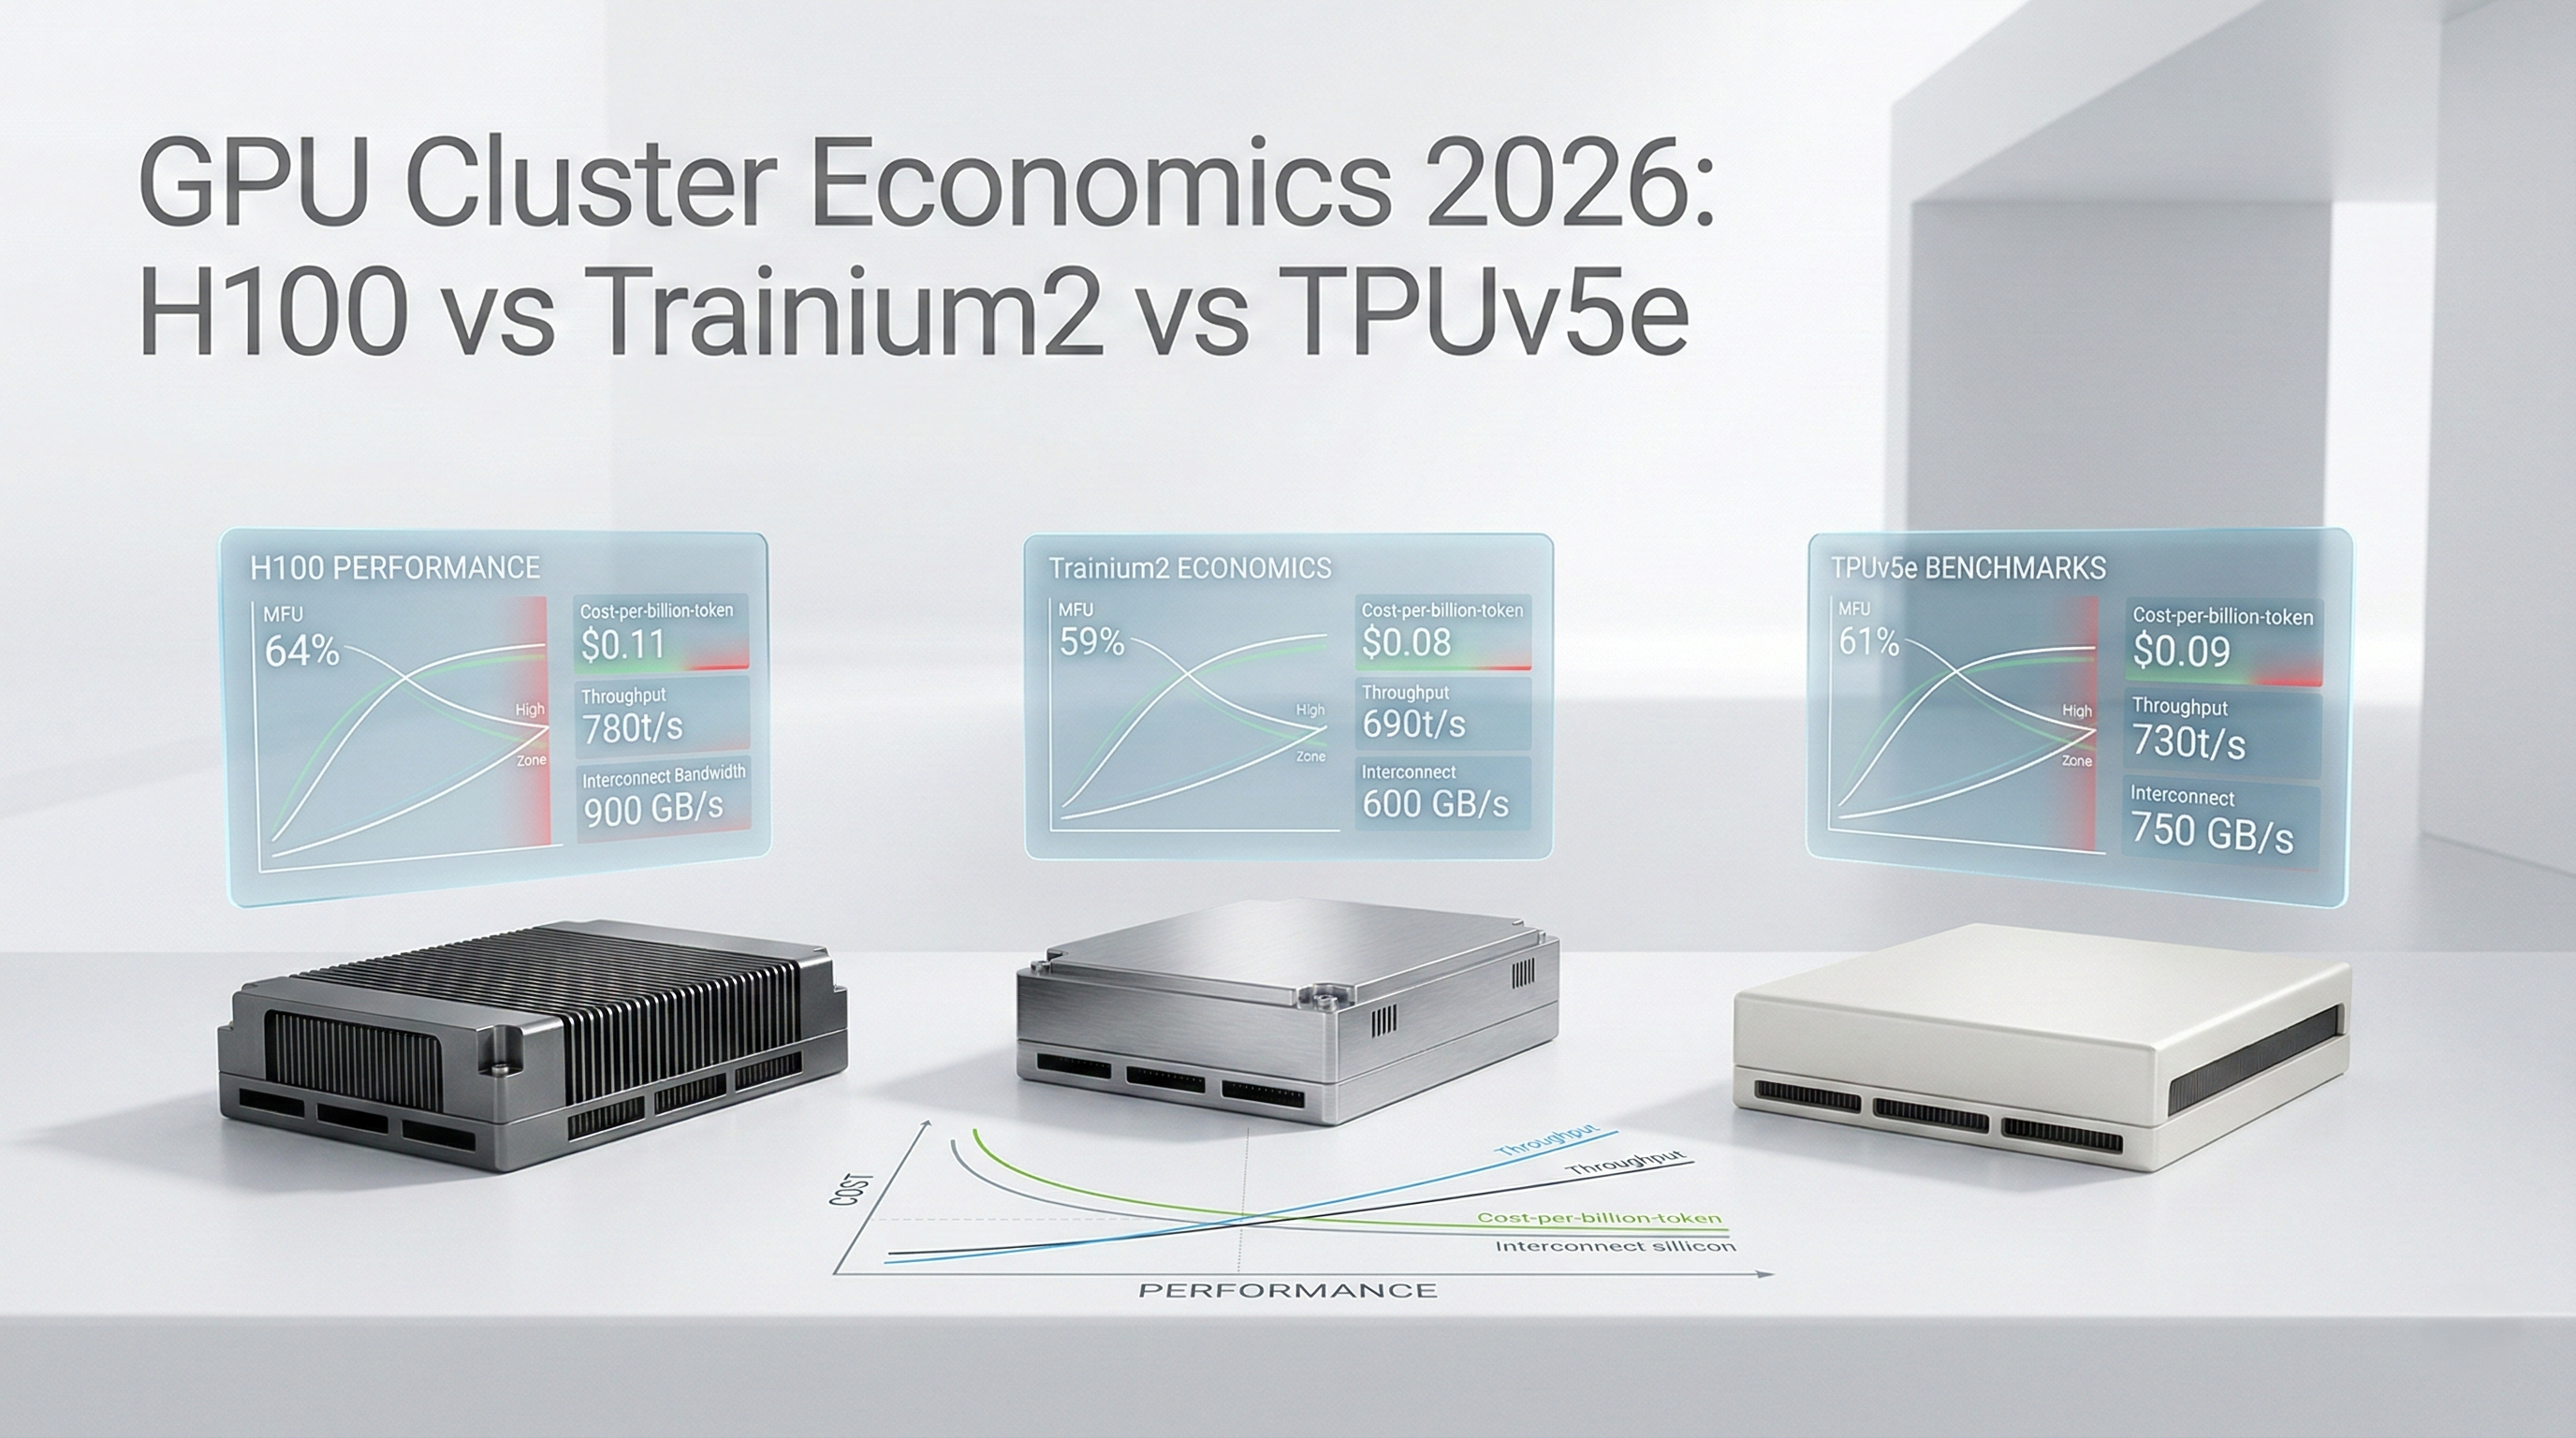
As enterprise artificial intelligence transitions from experimental model tuning to massive-scale foundational model training and high-throughput production inference, the underlying unit economics of silicon have become the primary determinant of AI profitability. The 2026 market presents a complex tri-poly: NVIDIA's entrenched dominance (H100/H200/B100) offering maximum flexibility and raw performance, competing against hyperscaler custom silicon—specifically AWS Trainium2 and Google Cloud TPUv5e—which promise radical cost-to-performance advantages at the expense of vendor lock-in and compiler friction.
Comparing these hardware platforms on a simple hourly compute rate (e.g., dollars per GPU hour) is a catastrophic financial failure. The true Total Cost of Ownership (TCO) of an AI cluster is dictated by a convergence of Model Flops Utilization (MFU), interconnect network bandwidth costs (Infiniband vs. AWS EFA vs. Google Titanium), fault tolerance degradation, and the engineering friction associated with optimizing PyTorch or JAX for non-NVIDIA accelerators. A cluster of 1,024 Trainium2 chips may look 40% cheaper on paper than an equivalent H100 cluster, but if the compiler efficiency yields only a 25% MFU compared to a highly optimized TensorRT-LLM stack hitting 55% MFU on NVIDIA, the time-to-train extends linearly, entirely eliminating the cost advantage and severely delaying time-to-market.
This playbook provides the advanced financial mechanics required to evaluate hardware acquisition or cloud reservation strategies for AI infrastructure. By moving beyond naive hourly rates, enterprise architects and FinOps leaders can construct models that calculate the exact cost per billion tokens generated, or the precise capital requirement for a 100-billion parameter training run. It demands a rigorous evaluation of the networking egress penalties associated with multi-node training and the hidden costs of checkpointing failures.
To survive the AI margin crush, enterprises must achieve hardware abstraction. By leveraging frameworks like Ray and JAX, organizations can dynamically route workloads to the most cost-efficient silicon available, breaking the NVIDIA premium when appropriate, while reserving expensive H100 fleets exclusively for workloads that strictly require CUDA dependencies or ultra-low latency inference. This playbook establishes the mathematical baseline to navigate the 2026 accelerator wars profitably.
2. Market Gap & Search Intent Failure Analysis
The overwhelming majority of literature regarding GPU economics suffers from a fundamental "brochure-ware" flaw. Searches for "H100 vs TPUv5e cost" return superficial comparisons of cloud provider list prices multiplied by the number of chips. These models assume 100% utilization and zero network bottlenecking, a state that never exists in production.
The critical market gap is the failure to model the physics of distributed AI workloads. When training a 70B parameter model across 64 nodes, the compute chips spend a significant percentage of their time idle, waiting for data to traverse the network (all-reduce operations). Analysts ignore this communication overhead, failing to realize that cheaper compute chips often require more nodes to achieve the same throughput, thereby exponentially increasing the networking penalty. Furthermore, generic models fail to quantify the human engineering cost: migrating a complex deep learning codebase from CUDA to AWS Neuron (Trainium) requires specialized, high-cost engineering talent and months of iteration. Failing to capitalize these engineering hours into the overall TCO equation leads to drastically flawed capital allocation decisions. This playbook bridges that gap with the Effective Token Yield framework.
3. Core Strategic Framework
The optimal framework for evaluating AI infrastructure is the Effective Token Yield (ETY) Framework. ETY mandates that silicon is not evaluated on peak theoretical TFLOPS, but on the financially modeled cost to produce a measurable output unit (e.g., a successfully trained model or 1 million inference tokens) after accounting for all systemic inefficiencies.
Implementation Protocol:
Workload Profiling: Classify the workload as either Memory-Bound (e.g., large batch inference, KV cache heavy) or Compute-Bound (e.g., deep training, dense matrix multiplication).
Compiler Efficiency Benchmarking: Run a 5% scale benchmark on the target silicon (H100, TPUv5e, Trn2) to establish the empirical MFU baseline for the specific enterprise model architecture.
Interconnect Penalty Calculation: Measure the network latency and bandwidth across multiple nodes (NVSwitch/Infiniband vs EFA vs Google custom networking).
Decision Matrix:
If Workload requires deeply nested custom CUDA kernels: Default to H100.
If Workload is standard Transformer architecture, inference-heavy, and batch size is massive: Target TPUv5e.
If Workload is training from scratch within a purely AWS-native ecosystem: Target Trainium2, provided engineering migration cost is amortized over $> \$2M$ in compute spend.
4. Financial Modeling Layer (MANDATORY)
The following models calculate the true economic reality of AI clusters.
Core Equations
1. The True Cost per Training Run ($C_{run}$):
This equation determines the total cost to train a model, factoring in chip utilization and network overhead.
$$C_{run} = \left( \frac{Total\_FLOPs\_Required}{Peak\_TFLOPS \times MFU \times N_{chips}} \right) \times (C_{compute\_hr} + C_{net\_hr}) \times (1 + R_{failure})$$
Where:
$MFU$ = Model Flops Utilization (percentage of peak theoretical performance actually achieved).
$N_{chips}$ = Number of accelerator chips in the cluster.
$C_{compute\_hr}$ = Hourly cost of the compute instances.
$C_{net\_hr}$ = Hourly cost of specialized networking (e.g., Infiniband premiums).
$R_{failure}$ = Restart penalty rate (percentage of time lost to node failure and checkpoint recovery).
2. Effective Token Inference Cost ($ETIC$):
For production SaaS models, the cost per 1 million tokens must account for KV cache memory bottlenecks.
$$ETIC = \frac{C_{cluster\_hr} \times 1,000,000}{Throughput_{tokens/hr} \times (1 - Mem_{fragmentation})}$$
Where:
$Mem_{fragmentation}$ = Loss of usable memory due to inefficient KV cache management (typically 0.10 to 0.20 depending on the serving engine like vLLM).
3. Engineering Migration Breakeven ($EMB$):
Calculates the point at which migrating off NVIDIA to custom silicon becomes profitable.
$$EMB = \frac{Hours_{eng} \times Rate_{eng\_hr}}{(C_{H100\_run} - C_{CustomSilicon\_run})}$$
A) Sensitivity Analysis Table
This table illustrates the financial impact (TCO) of training a 100B parameter model based on the achieved MFU across different silicon architectures.
Variable (Hardware & MFU) | Low Case (25% MFU) | Base Case (45% MFU) | High Case (60% MFU) | Financial TCO Impact |
NVIDIA H100 ($100/hr per 8x) | $4.2M TCO | $2.3M TCO | $1.7M TCO | High baseline cost, easiest to hit high MFU |
GCP TPUv5e ($45/hr per pod) | $3.8M TCO | $2.1M TCO | $1.5M TCO | Requires JAX optimization to achieve High Case |
AWS Trainium2 ($55/hr per 8x) | $4.6M TCO | $2.5M TCO | $1.9M TCO | Lower base cost, but Neuron compiler risks low MFU |
Decision Threshold: If empirical MFU testing on Trainium2 falls below 30%, the migration project must be abandoned, and capital re-allocated to H100s to avoid cost blowouts driven by extended cluster runtime.
B) Break-Even Formula
The Break-Even volume ($V_{be}$) in generated inference tokens required to justify a dedicated provisioned H100 cluster over utilizing a serverless API provider (e.g., Anthropic/OpenAI/Bedrock).
$$V_{be} = \frac{(N_{nodes} \times C_{node\_monthly}) + C_{SRE\_support}}{Price_{API\_per\_token} - Cost_{Internal\_per\_token}}$$
Numerical Example: If an H100 cluster costs $80,000/month, SRE support is $20,000/month, API price is $0.01 per 1k tokens, and internal cost is $0.002 per 1k tokens, the enterprise must generate at least 12.5 Billion tokens per month to break even on the dedicated infrastructure.
C) Probability-Weighted Risk Table
Quantifying the financial risks associated with large-scale GPU cluster operations.
Scenario | Probability | Financial Impact | Weighted Exposure |
Multi-Node Interconnect Failure (Stranded Compute) | 8.0% | $45,000 (Wasted cluster hours) | $3,600 per run |
Compiler Incompatibility (Migration Failure) | 15.0% | $150,000 (Sunk engineering cost) | $22,500 per project |
Spot Instance Preemption (Checkpoint Loss) | 25.0% | $12,000 (Lost compute time) | $3,000 per event |
Memory Out-of-Bounds Error (OOM) | 12.0% | $5,000 (Restart and tuning) | $600 per event |
D) Cost-per-Unit Model
The central unit is the Cost Per Billion Tokens (CPBT).
$$CPBT = \frac{Cluster\_Monthly\_Amortization + Monthly\_Energy\_Cost}{Total\_Tokens\_Generated\_in\_Billions}$$
Threshold: If $CPBT > \$1,500$ for a 70B parameter class model, the infrastructure is severely unoptimized, and the FinOps team must mandate the integration of dynamic batching and INT8/FP8 quantization.
5. Operational Architecture Integration
Multi-Silicon Abstraction on Kubernetes:
To avoid vendor lock-in, modern enterprises construct abstraction layers. Workloads are orchestrated via Kubernetes (EKS/GKE) using frameworks like KubeRay. The architecture dictates that the application layer requests resources generically (e.g., accelerator_type: generic-transformer-capable), and the custom Kubernetes scheduler evaluates the spot market. If TPUv5e spot instances drop in price, the scheduler utilizes the JAX-compiled version of the model and provisions the TPU pod.
AWS Trainium2 / Inferentia Integration:
Deploying on AWS custom silicon requires deep integration with AWS Neuron SDK. FinOps and engineering must co-own the architecture to ensure that models are compiled ahead-of-time (AOT). Compiling models on-the-fly inside the production cluster causes massive CPU spikes and API latency, destroying the unit economics. The architecture must include a dedicated CI/CD pipeline step specifically for Neuron compilation, storing the serialized artifacts in S3 for rapid inference node bootstrapping.
Google TPUv5e and Megapod Architecture:
TPUs operate optimally in tightly coupled pod topologies utilizing Google's optical circuit switches. TCO models here must account for the fact that TPUs are accessed via VMs over the network, fundamentally altering the latency profile compared to PCIe-attached GPUs. Architecture must route data-parallel training jobs to TPUs utilizing PyTorch/XLA, ensuring zero CPU-to-TPU data transfer bottlenecks during the training loop.
6. Failure Scenarios
Scenario 1: The MFU Illusion
Breakdown: An enterprise reserves a massive Trainium2 cluster because the hourly rate is 35% cheaper than NVIDIA H100s. However, their custom model architecture relies on specific memory access patterns that the Neuron compiler cannot optimize. The resulting MFU is 18%. The training job takes 3x longer than it would have on H100s.
Financial Exposure: $1M to $3M in excess cloud compute costs, plus a 2-month delay in product launch.
Governance Prevention Layer: Mandatory empirical validation. FinOps governance strictly prohibits 1-year or 3-year compute reservations for custom silicon unless engineering provides verifiable benchmark logs proving MFU > 40% on a 5% scale test run.
Scenario 2: The Infiniband Tax Squeeze
Breakdown: SREs provision bare-metal NVIDIA GPUs across multiple disparate racks without verifying the non-blocking network topology. During a massive all-reduce operation, the network bottlenecks. The GPUs sit idle at 15% utilization while waiting for network packet delivery.
Financial Exposure: Paying $100/hour per node for compute, while getting $15/hour of actual mathematical output. Extrapolated over a month, this wastes hundreds of thousands of dollars.
Governance Prevention Layer: Deployment of NCCL (NVIDIA Collective Communications Library) monitoring agents. If network wait time exceeds 20% of total compute time, an automated alert halts the training run and alerts the FinOps team to the architectural flaw.
Scenario 3: Catastrophic Spot Churn
Breakdown: To save money, a 64-node cluster is deployed entirely on spot instances. The fault tolerance layer is misconfigured, taking 15 minutes to save a checkpoint. The spot instances are preempted every 4 hours. The cluster spends 40% of its lifecycle saving and restoring states rather than progressing the model.
Financial Exposure: 40% of total cluster cost wasted on I/O overhead.
Governance Prevention Layer: Spot utilization policy. AI training workloads are prohibited from running on 100% spot if the checkpoint time exceeds 5% of the Mean Time Between Interruption (MTBI) for the selected instance family.
7. Board-Level Translation Layer
EBITDA Delta Modeling: Every percentage point increase in MFU directly flows to EBITDA by reducing the raw hours required for expensive GPU reservations. Optimizing a pipeline from 30% to 50% MFU on a $10M annual GPU spend recovers $4M directly to the bottom line.
Gross Margin Defense: The cost of inference token generation is the modern equivalent of COGS for AI-integrated SaaS. Transitioning steady-state inference from expensive H100s to AWS Inferentia2 or TPUv5e can compress COGS by 40-60%, defending gross margins as user adoption scales.
Capital Allocation Signal: CapEx heavy investments (e.g., 3-year Reserved Instances or bare-metal leases) in NVIDIA hardware carry a depreciation risk as B100s and next-gen silicon arrive. The board must evaluate the "liquidity" of their compute strategy.
Risk-Adjusted ROI Formula:
$$ROI = \frac{\text{Value of Model in Market} - (\text{Hardware TCO} + \text{Engineering Migration Cost})}{\text{Capital Risk of Vendor Lock-in}}$$
8. Data Visualization Suggestions
A line graph with MFU on the X-axis and Total Cost ($M) on the Y-axis. Three curves representing H100, Trainium2, and TPUv5e, showing how poor compiler efficiency destroys cost advantages.
A visual representation of a cluster, shading GPUs red to indicate idle time while data transverses a congested network switch, highlighting the "Infiniband Tax."
A side-by-side comparison of the real cost to generate 1 Billion tokens across different architectures, factoring in memory fragmentation and power consumption.
A time-series chart showing compute utilization over time, with severe dips highlighting the wasted hours spent recovering from spot node terminations.
A technical architecture diagram showing Kubernetes/Ray acting as a routing layer, directing PyTorch workloads dynamically to the cheapest available silicon backend.
9. Why Analyst-Style Summaries Fail at Financial Precision
When technology analysts declare that "Custom silicon offers significant cost savings over GPUs," they are summarizing list prices while ignoring the physics of deep learning. Narrative summaries fail because they cannot calculate compiler friction or multi-node networking degradation.
If an analyst tells a CIO that Trainium2 is $X cheaper per hour, the CIO allocates a budget based on that rate. The FinOps team is then held accountable when the actual cost is 200% higher because the engineering team spent three months rewriting custom operators to make the model run, and the final cluster achieved a disastrously low MFU. Equation-backed modeling, specifically evaluating $C_{run}$ and $MFU$, prevents this structural failure. It forces the enterprise to quantify the mathematical reality of distributed compute overhead before signing a multi-million dollar cloud commitment. Precision modeling replaces marketing claims with empirical reality.
10. Strategic Conclusion
The 2026 AI hardware landscape requires enterprises to operate with the sophistication of hyperscalers. The strategy of blindly defaulting to NVIDIA H100 reservations is mathematically sound only for organizations where engineering time is infinitely more expensive than compute, or where absolute peak performance is a matter of survival. For all others, defending AI gross margins requires exploiting the tri-poly of hardware availability.
This requires building infrastructure abstraction. By standardizing on frameworks like Ray, PyTorch 2.x, and JAX, organizations decouple their AI models from specific silicon. This enables FinOps teams to operate a highly liquid compute strategy, leveraging Google TPUv5e for massive batch inference, AWS Trainium2 for native deep training loops, and reserving costly NVIDIA silicon strictly for workloads demanding highly optimized CUDA kernels or dynamic, low-latency execution.
The financial risk is severe: purchasing cheaper hardware that results in massive MFU degradation will destroy an enterprise's AI profitability. Therefore, all compute procurement decisions must be routed through the Effective Token Yield framework. Do not buy TeraFLOPS; buy empirical token throughput. By integrating networking penalties, engineering migration costs, and rigorous fault tolerance modeling, FinOps leaders can architect AI infrastructure that is both relentlessly performant and financially sustainable.
11. Implementation Readiness Checklist
Establish Baseline MFU Metrics: Mandate that the engineering team instruments all training loops to continuously log and report Model Flops Utilization to the FinOps telemetry dashboard.
Conduct 5% Scale Silicon Bake-Offs: Before any reservation >$500k, require the workload to run at 5% scale on H100, TPU, and custom silicon to establish empirical baseline performance.
Deploy Hardware Abstraction Layers: Integrate Ray or KubeRay to decouple the application layer from specific GPU architectures.
Implement Dynamic Inference Routing: Deploy routing logic that sends high-latency-tolerant asynchronous inference tasks to cheaper custom silicon, reserving premium GPUs for real-time user requests.
Audit Interconnect Topologies: Verify that all multi-node GPU clusters are utilizing non-blocking, high-bandwidth topologies (e.g., proper placement groups, EFA enablement) to prevent network-induced idle time.
Calculate Internal Cost Per Billion Tokens: Establish the baseline CPBT for all production SaaS models and track it weekly as a core KPI for the AI product team.
Optimize Checkpointing Strategy: Ensure fault tolerance mechanisms can save cluster state in under 3% of the Mean Time Between Interruption (MTBI) when utilizing Spot/Preemptible instances.
Evaluate Memory Fragmentation: Audit inference engines (e.g., vLLM, TensorRT-LLM) to ensure KV cache fragmentation is minimized, preventing out-of-memory errors that destroy unit economics.
Quantify Engineering Migration Costs: Force all proposals for moving to non-NVIDIA silicon to include a capitalized estimate of the engineering hours required to adapt the codebase.
Establish MFU Threshold Governance: Create automated cloud policy alerts that instantly flag and suspend any distributed training job running with an MFU below 25%, pending architectural review.
Stop guessing where your Kubernetes budget is going. Schedule a demo here to explore Kubernetes cost monitoring with Cloud Atler.