
1. Executive Synthesis
For decades, the funding of enterprise cybersecurity has operated on a fundamentally flawed premise: Fear, Uncertainty, and Doubt (FUD). CISOs secure multi-million dollar budgets by presenting board members with terrifying anecdotes of global ransomware attacks, zero-day exploits, and regulatory devastation. Because security is treated as a mystical black box rather than a quantifiable operational discipline, Chief Financial Officers (CFOs) struggle to apply standard Return on Investment (ROI) metrics. By 2026, as cloud complexity explodes and threat actors leverage autonomous AI agents, the "blank check" era of cybersecurity spending has violently ended.
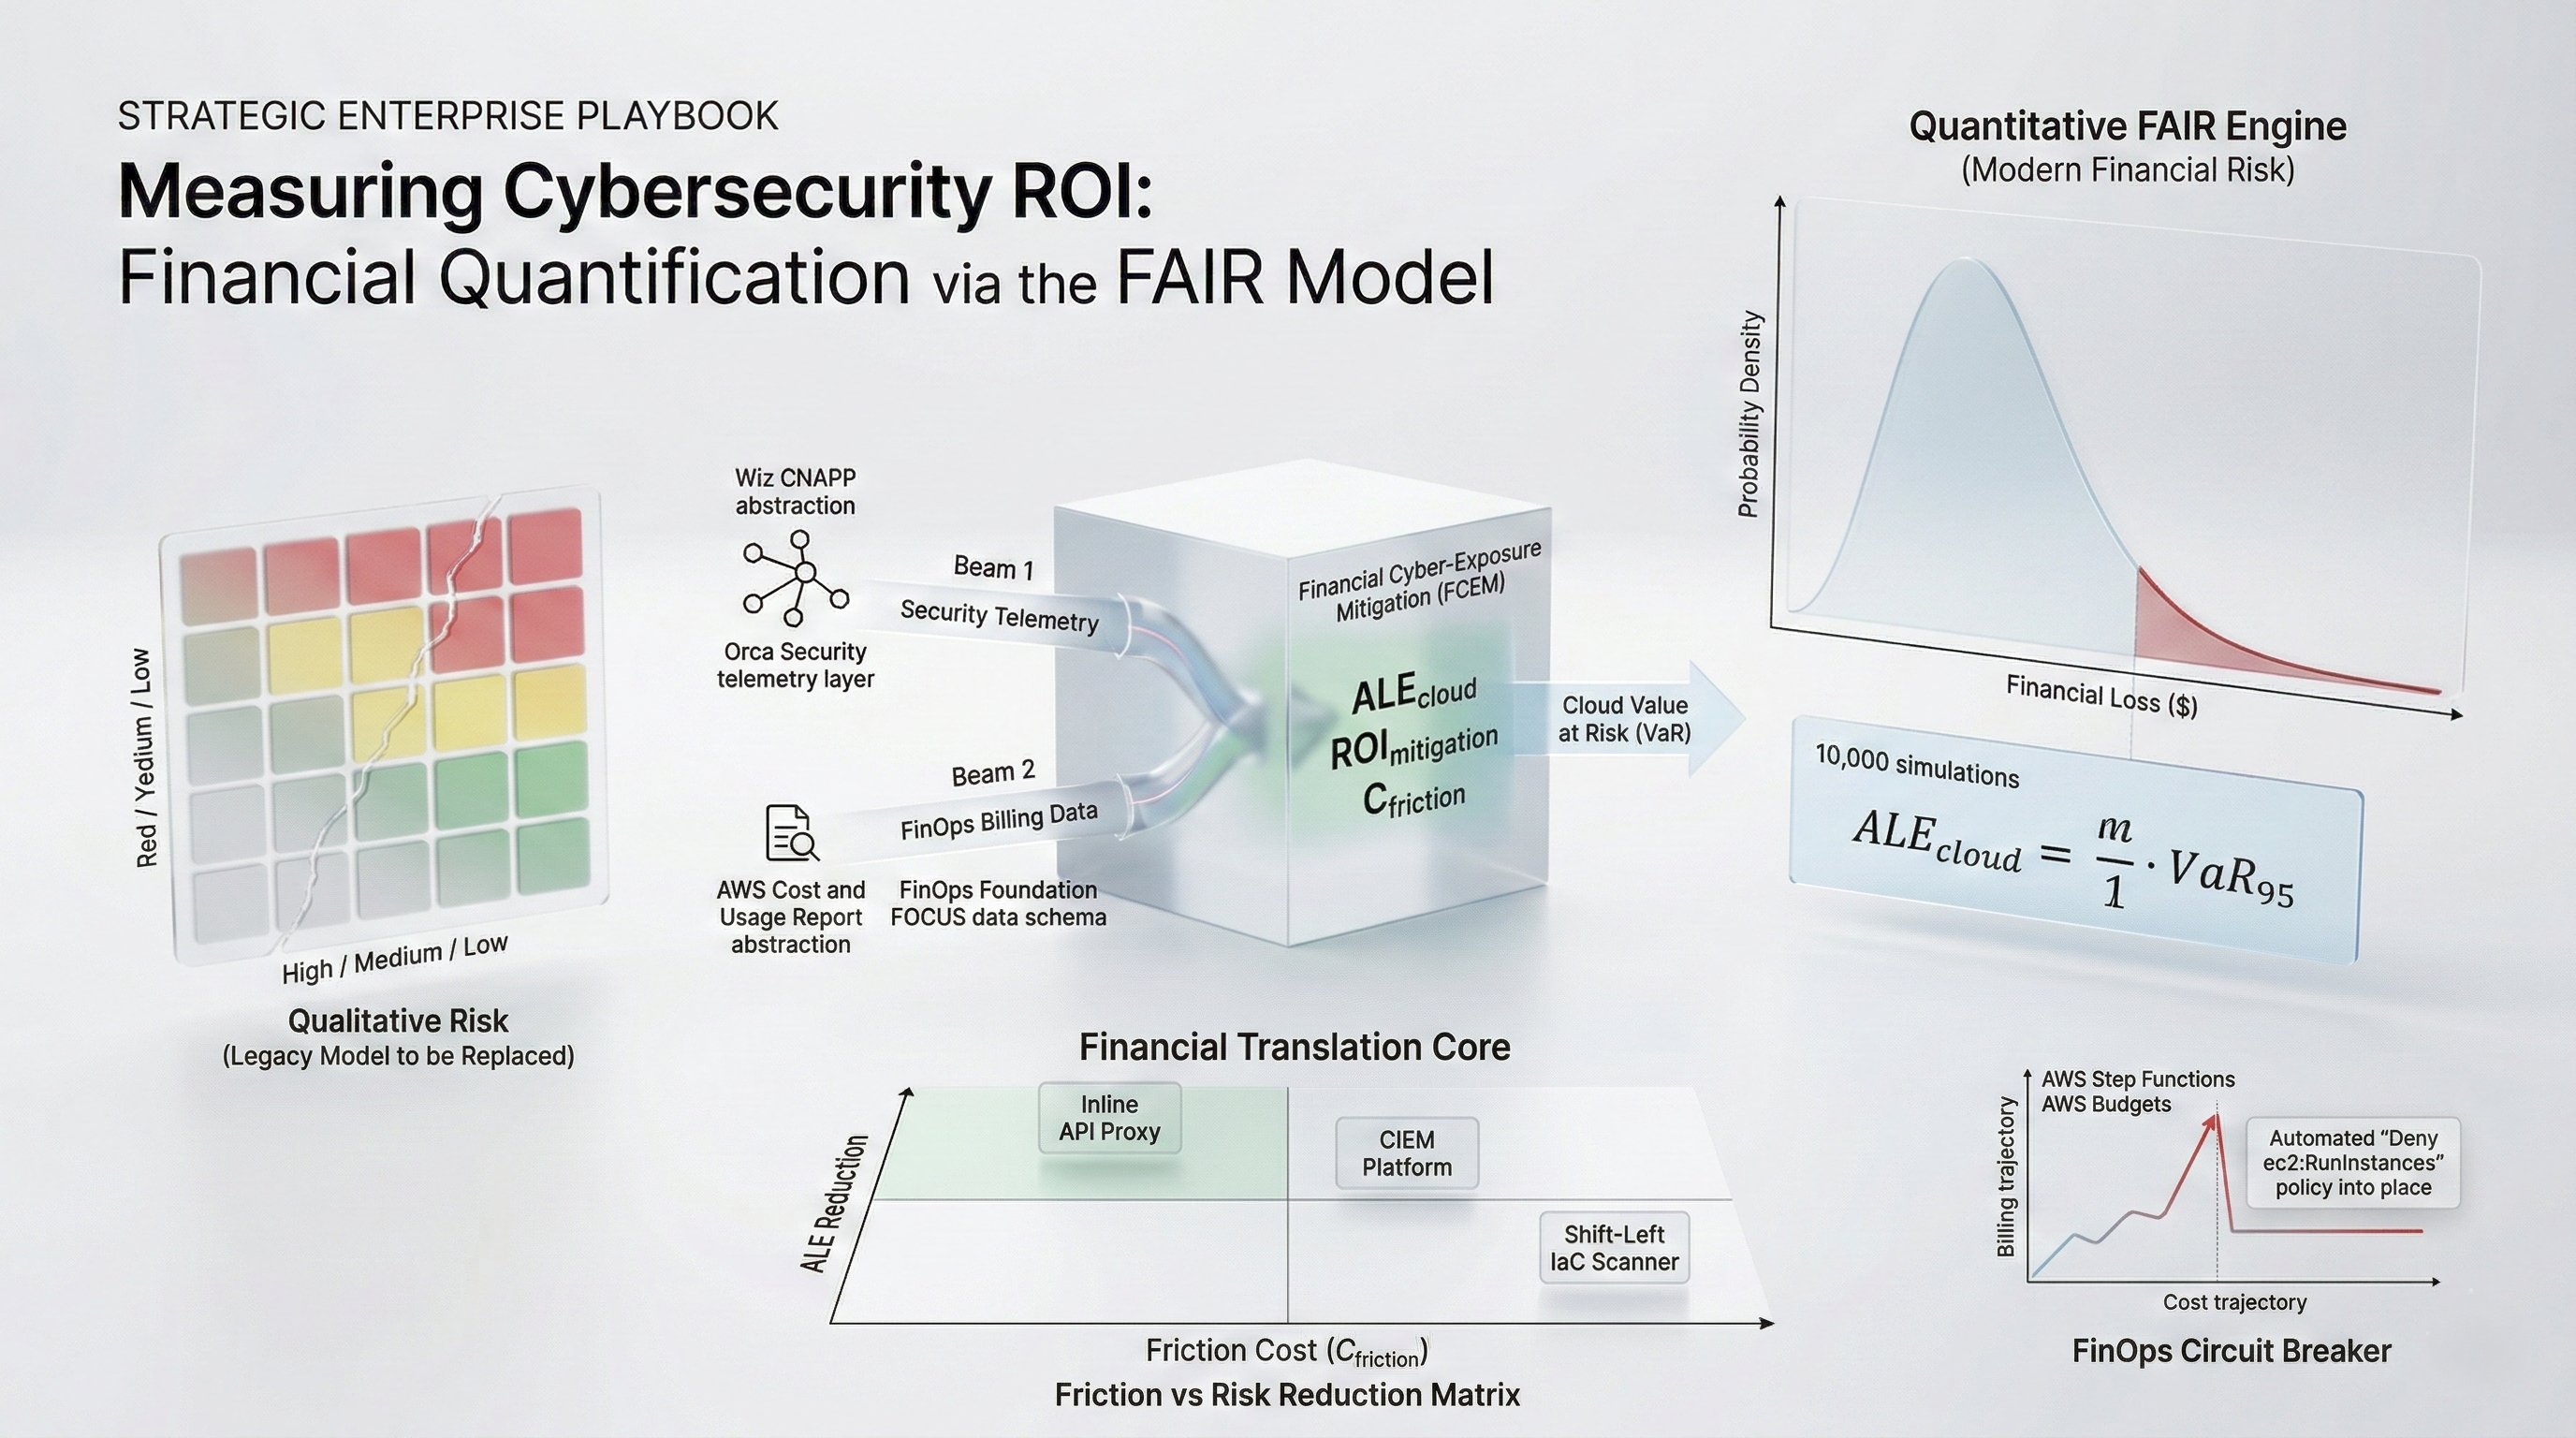
The 2026 enterprise mandate requires transitioning cybersecurity from a qualitative art to a quantitative, mathematically rigorous financial discipline deeply integrated with FinOps. The operationalization of the Factor Analysis of Information Risk (FAIR) model is the architectural key to this transition. FAIR strips away narrative fear and replaces it with stochastic mathematics—specifically, Monte Carlo simulations that calculate the Annualized Loss Expectancy (ALE) based on precise Threat Event Frequencies and Probable Magnitudes.
However, standard FAIR models fail in modern cloud environments because they do not account for the specific elasticity and blast radius of hyper-scaled infrastructure. This playbook establishes the Financial Cyber-Exposure Mitigation (FCEM) Framework, uniquely adapting FAIR for multi-cloud FinOps. It demands that enterprises quantify the exact "Blast Radius Cost" of an IAM breach by linking security telemetry (e.g., from a CNAPP like Wiz or Orca) directly to the FOCUS billing data lake.
Furthermore, the FCEM framework forces CISOs to mathematically justify security tooling by calculating the Friction Penalty ($C_{friction}$)—the financial cost of slowing down developer velocity. If deploying a new inline API firewall reduces the probability of a breach by $500,000 annually, but the latency and CI/CD pipeline friction delays product launches costing $1.2M in lost revenue, the security tool is financially destructive. By utilizing this playbook, FinOps and Security leaders can collaboratively allocate capital strictly to the mitigating controls that provide a mathematically proven reduction in Cloud Value at Risk (VaR).
2. Market Gap & Search Intent Failure Analysis
Search intent surrounding "Cybersecurity ROI" or "How to measure security value" typically yields disastrously unscientific results. Vendors publish calculators that claim "Tool X prevents 10,000 attacks a month; at $1,000 per attack, your ROI is $10M." This is mathematical fiction. An automated bot scanning an open port is not an "attack" that costs the enterprise $1,000; it is background internet noise.
The structural market gap is the reliance on ordinal risk matrices (the classic 5x5 Heat Maps colored Red, Yellow, and Green). Analysts use heat maps to define risk as "High Probability / High Impact." This is useless for financial allocation. You cannot budget against "Red." You cannot calculate an ROI against "Yellow." Heat maps mask a total lack of quantitative rigor. This playbook destroys the heat map methodology by injecting the FAIR ontology and Monte Carlo probability distributions, allowing the CISO to state: "There is a 10% probability that a cloud IAM breach will cost us between $2.1M and $4.5M next year. Spending $300,000 on Just-In-Time access controls reduces that probable exposure to $400k, yielding a quantified ROI of 600%."
3. Core Strategic Framework
The enterprise must implement the Financial Cyber-Exposure Mitigation (FCEM) Framework. This framework forces the collision of security vulnerability telemetry with FinOps cost data, translating technical cloud misconfigurations into direct financial exposure metrics.
Implementation Protocol:
Asset Value Profiling: Integrate the enterprise CNAPP (Cloud-Native Application Protection Platform) with the FOCUS FinOps database. A vulnerability on an EC2 instance is financially scored based on the daily revenue processed by the billing tags associated with that node.
Execute FAIR Monte Carlo Modeling: Utilize historical incident data and industry benchmarks to establish ranges for Threat Event Frequency (TEF) and Probable Loss Magnitude (PLM). Run 10,000 stochastic simulations to generate the Cloud Value at Risk (VaR) distribution.
Calculate the Friction Penalty ($C_{friction}$): Measure the CI/CD deployment delay or application latency introduced by a proposed security tool and convert that time into an exact dollar cost based on engineering labor rates and delayed time-to-market.
Execution Decision Matrix:
If proposed $ROI_{mitigation} > 3.0x$ AND $C_{friction}$ is $< 10\%$ of the expected savings, mandate the immediate procurement and deployment of the security control.
If a critical vulnerability carries a quantified ALE $> \$1M$, automatically fail the CI/CD pipeline and block deployment, regardless of engineering sprint deadlines.
If $C_{friction} > ALE_{reduction}$, reject the security tool. The cure is mathematically worse than the disease. Accept the risk.
4. Financial Modeling Layer (MANDATORY)
Defending security budgets requires treating cyber risk as a predictable financial equation.
Core Equations
1. Cloud Annualized Loss Expectancy ($ALE_{cloud}$):
Calculates the probable financial damage of a specific threat scenario over a 12-month period, derived from Monte Carlo simulation outputs.
$$ALE_{cloud} = \sum (TEF_{range} \times V_{vuln\_percentage}) \times PLM_{range}$$
Where:
$TEF_{range}$ = Threat Event Frequency (how often the attack is attempted).
$V_{vuln\_percentage}$ = Vulnerability (the probability the attack succeeds against current controls).
$PLM_{range}$ = Probable Loss Magnitude (cost of incident response, SLA fines, cloud resource hijacking).
2. Security Mitigation ROI ($ROI_{mitigation}$):
Determines the true financial value of a security investment by comparing the reduction in ALE against the fully loaded cost of the control, including operational friction.
$$ROI_{mitigation} = \frac{(ALE_{current} - ALE_{mitigated}) - (C_{tool\_capex} + C_{ops\_labor} + C_{friction})}{C_{tool\_capex} + C_{ops\_labor}}$$
Where:
$ALE_{mitigated}$ = The new, lower expected loss after the tool is deployed.
$C_{tool\_capex}$ = Annual cost of the security software/vendor.
$C_{ops\_labor}$ = Cost of the SOC analysts required to manage the tool.
3. The Friction Penalty ($C_{friction}$):
Quantifies the hidden cost of security tools that slow down enterprise velocity.
$$C_{friction} = (H_{pipeline\_delay} \times R_{eng\_hr} \times N_{deployments}) + (L_{app\_latency} \times R_{revenue\_drop})$$
A) Sensitivity Analysis Table
This table models the $ROI_{mitigation}$ of deploying a $250,000 Cloud Identity Entitlement Management (CIEM) platform to prevent IAM hijacking, mapped against the expected reduction in vulnerability and the Friction Penalty.
Variable (Friction Cost) | Low Vuln Reduction (20%) | Base Vuln Reduction (50%) | High Vuln Reduction (80%) | Strategic Action |
Low Friction ($50k) | -20% ROI (Negative) | +150% ROI ($375k Value) | +350% ROI | Deploy Tool |
Med Friction ($150k) | -60% ROI | +110% ROI ($275k Value) | +310% ROI | Deploy Tool |
High Friction ($500k) | -200% ROI | -40% ROI (Value Destroyed) | +150% ROI | Re-architect implementation |
Decision Threshold: Security tools that introduce massive operational friction (e.g., inline inspection proxies that break CI/CD pipelines) frequently destroy more financial value than they save, resulting in negative ROI even if they successfully stop the breach.
B) Break-Even Formula
The Risk Tolerance Break-Even ($RT_{be}$) calculates the exact vulnerability percentage where an enterprise should stop buying security software and simply accept the residual risk or buy cyber insurance.
$$RT_{be} = \frac{C_{tool\_capex} + C_{ops\_labor} + C_{friction}}{TEF \times PLM}$$
Numerical Example: A new container security tool costs $100k, requires $50k of labor, and introduces $50k of friction (Total Cost: $200k). The threat frequency is 1 attack/year, and the probable magnitude is $1M. The Break-Even is $200k / $1M = 0.20 (20%). If your existing defenses already stop 85% of attacks (Vulnerability is only 15%), buying this tool costs more than the expected loss. Do not buy it. Accept the 15% risk.
C) Probability-Weighted Risk Table
Quantifying specific cloud threat scenarios using the FCEM/FAIR methodology.
Scenario | Probability (TEF x V) | Financial Impact (PLM) | Weighted Exposure (ALE) |
S3 Bucket Extortion (Ransomware) | 8.0% / year | $2,500,000 (Fines/Recovery) | $200,000 per year |
IAM Hijacking (Crypto-mining drain) | 15.0% / year | $400,000 (Cloud compute bill) | $60,000 per year |
DDoS API Exhaustion (Fargate spike) | 35.0% / year | $85,000 (Auto-scaling costs) | $29,750 per year |
Malicious Insider Data Exfiltration | 2.5% / year | $5,000,000 (IP Loss/Brand) | $125,000 per year |
D) Cost-per-Unit Model
The core metric for CISO operational efficiency is the Cost Per Quantified Risk Unit ($CQRU$):
$$CQRU = \frac{Total\_Security\_Budget}{Total\_ALE\_Reduction\_Achieved}$$
Threshold: If $CQRU$ exceeds $1.00 (i.e., you are spending $1.50 to reduce your ALE by $1.00), the security program is massively inefficient and bloated. FinOps must intervene to sunset overlapping security vendors and consolidate agents.
5. Operational Architecture Integration
CNAPP and FinOps Data Fusion:
In a 2026 architecture, security telemetry cannot exist in a vacuum. A CNAPP tool (e.g., Wiz) detects a public-facing EC2 instance with an unpatched Log4j vulnerability. Historically, this is just a "Critical Alert." The FCEM framework demands that the CNAPP API be queried against the FOCUS 1.2 billing database. The automated system identifies that this specific EC2 instance is tagged App: Global-Payments and processes $2M in revenue daily. The FAIR model dynamically recalculates the Probable Loss Magnitude ($PLM$) for that specific alert to $2M, escalating it above thousands of other "Critical" alerts on non-revenue generating dev nodes. This guarantees that SREs remediate based on financial blast radius, not generic CVSS scores.
Automated Cloud Compute Hijacking Defense:
Threat actors frequently compromise IAM keys not to steal data, but to spin up hundreds of massive GPU instances (p4d.24xlarge) for crypto-mining or AI training, generating a $500,000 cloud bill in 48 hours. Architecture must implement FinOps Circuit Breakers. Using AWS Budgets and Step Functions, if a specific account's compute spend trajectory spikes $> 400\%$ above its 7-day moving average, a serverless function automatically assumes a cross-account role and applies a strict explicit Deny Service Control Policy (SCP) for all ec2:RunInstances commands globally, quarantining the financial hemorrhage in seconds.
Shift-Left Security Friction Management:
To reduce the $C_{friction}$ variable, security must be moved entirely to the infrastructure-as-code (IaC) pipeline. Utilizing tools like Checkov or OPA Gatekeeper, terraform plans are scanned for misconfigurations (e.g., an S3 bucket lacking KMS encryption) during the Git Pull Request phase. By providing developers with instantaneous, automated feedback before deployment, the friction cost drops from thousands of dollars (re-architecting production systems) to pennies (a 30-second code fix).
6. Failure Scenarios
Scenario 1: The Infinite FinOps Hijack
Breakdown: A developer commits an AWS access key to a public GitHub repository. Within 4 seconds, automated bots scrape the key. By Friday night, the bots spin up 500 GPU instances across unmonitored regions (e.g.,
af-south-1). Because the FinOps team only checks billing reports on Monday mornings, the enterprise incurs a $450,000 EC2 bill over the weekend.Financial Exposure: Total, unrecoverable cloud compute debt.
Governance Prevention Layer: Mandatory Regional SCPs and FinOps Circuit Breakers. Governance mandates that all unused hyperscaler regions are cryptographically disabled via Organizational SCPs. Furthermore, anomalous billing spikes must trigger immediate, automated lambda functions that revoke compromised IAM keys without human intervention.
Scenario 2: The Redundant Tooling Bloat
Breakdown: Following a minor incident, the board demands action. The CISO procures an Endpoint Detection and Response (EDR) tool, a Cloud Workload Protection Platform (CWPP), and a dedicated Container Security agent. All three tools deploy sidecars into the Kubernetes clusters, consuming massive CPU resources while detecting the exact same vulnerabilities.
Financial Exposure: The enterprise spends $800,000 on licenses and another $1.2M in compute overhead to run the security agents, achieving a $CQRU$ of $3.50. The tools destroy more financial value than the breach they were meant to stop.
Governance Prevention Layer: Security FinOps Audits. FinOps strictly measures the CPU/RAM consumption of
DaemonSetsspecifically tagged assecurity-agent. If the overhead of running a security agent exceeds 5% of the total cluster compute cost, the CISO is forced to justify the deployment mathematically using the $ROI_{mitigation}$ equation.
Scenario 3: Heat Map Capital Misallocation
Breakdown: A CISO uses a qualitative 5x5 Heat Map and demands $2M to mitigate a "High Risk" Advanced Persistent Threat (APT) scenario. The board approves it. They ignore a "Medium Risk" automated DDoS vulnerability because it is colored yellow. The DDoS attack happens, taking down the primary SaaS API for 12 hours, violating SLAs and causing $3M in customer churn.
Financial Exposure: $2M wasted on mitigating a statistically improbable event, while suffering a $3M loss from an unmitigated, high-frequency event.
Governance Prevention Layer: Mandatory FAIR Quantification. The CFO enacts a strict policy: zero capital expenditure will be approved for cybersecurity initiatives unless the request is accompanied by a Monte Carlo-backed FAIR analysis proving the exact ALE reduction and financial ROI. Qualitative risk matrices are banned from board presentations.
7. Board-Level Translation Layer
EBITDA Delta Modeling: Cyber attacks directly impact EBITDA through emergency response costs, regulatory fines, and cloud infrastructure theft. By utilizing the FCEM framework, the CISO proves to the board how a $500k investment dynamically protects $5M in EBITDA via mathematically derived ALE reduction, transitioning security from a sunk cost to a measurable margin defense mechanism.
Gross Margin Defense: Embedding security scanning early in the development lifecycle (lowering $C_{friction}$) ensures that product engineering velocity remains high while the infrastructure stays secure. High developer velocity keeps engineering CapEx efficient, directly supporting gross margin stability.
Capital Allocation Signal: A quantified cyber VaR (Value at Risk) allows the board to compare security investments identically to other business risks. If the $ROI_{mitigation}$ of a new firewall is 1.5x, but a new marketing campaign yields 4.0x, the board can mathematically justify accepting the residual cyber risk and allocating capital to growth.
Risk-Adjusted ROI Formula:
$$ROI_{cyber} = \frac{\text{Stochastic Reduction in Probable Loss Magnitude}}{\text{Total Cost of Control} + \text{Friction Penalty}}$$
8. Data Visualization Suggestions
A flow chart breaking down Risk into Loss Event Frequency and Probable Loss Magnitude, further dividing into Threat Capability, Vulnerability, and Asset Value.
A bell curve or histogram showing the probability of financial loss. A long, thin tail to the right visually represents the low-probability, catastrophic-impact breach scenarios.
An architectural diagram showing AWS Security Hub and AWS CUR data converging in a Snowflake database to calculate the exact "Financial Blast Radius" of an EC2 vulnerability.
A sequence diagram showing a billing anomaly triggering an EventBridge rule, firing a Lambda function that dynamically rewrites an IAM policy to contain a compromised credential in seconds.
A graph plotting various security tools. X-axis is Friction Cost ($C_{friction}$), Y-axis is ALE Reduction. The top-left quadrant represents high-value, low-friction tools (mandatory investment).
9. Why Analyst-Style Summaries Fail at Financial Precision
When cybersecurity analysts claim that "Enterprises must adopt Zero Trust architectures to secure their cloud perimeters," they are issuing a generic architectural directive that carries zero financial context.
Narrative summaries fail because they rely on qualitative fear. If a CIO follows this advice and attempts to implement a heavy, identity-aware proxy in front of an ultra-low latency AI inference API, the application latency will spike. The analyst's summary does not calculate the Friction Penalty ($C_{friction}$). It does not quantify the fact that the added latency will cause 15% of users to abandon the SaaS platform, costing the company millions.
Equation-backed modeling using the FCEM and FAIR frameworks destroys qualitative guesswork. By calculating the exact $ROI_{mitigation}$, the enterprise explicitly measures the cost of the security control against the probabilistic reduction in loss. It proves mathematically that sometimes the most financially sound decision an enterprise can make is to deliberately accept a security vulnerability because the cost of fixing it destroys the product's unit economics. You cannot govern enterprise risk with colors on a heat map; you must govern it with stochastic financial modeling.
10. Strategic Conclusion
The era of funding cybersecurity through fear and unquantifiable narratives is a failure of corporate governance. As the cloud attack surface scales infinitely—driven by ephemeral Kubernetes clusters, serverless functions, and AI API endpoints—the traditional approach of blindly buying overlapping security tools to chase a hypothetical state of "100% secure" is mathematically and financially impossible.
To achieve maturity in 2026, FinOps and Cybersecurity must merge into a unified discipline. Enterprise risk must be quantified using the Financial Cyber-Exposure Mitigation (FCEM) Framework. By integrating the stochastic rigor of the FAIR model, CISO and CFO leadership can calculate the precise Annualized Loss Expectancy (ALE) of cloud threats and directly map them against the financial velocity of the engineering organization.
This methodology enforces a brutal financial discipline upon the security organization. It demands that the "Friction Penalty" of any security tool—the cost of slowing down developers and degrading application performance—be explicitly capitalized against the expected savings. Furthermore, it mandates that security alerts are no longer prioritized by arbitrary CVSS scores, but by the actual FinOps-derived revenue flow of the vulnerable asset. Ultimately, cybersecurity is not an IT problem; it is a capital allocation problem. By utilizing exact equations, probability distributions, and automated FinOps circuit breakers, the enterprise can systematically drive down its Cloud Value at Risk while relentlessly defending its operational gross margins.
11. Implementation Readiness Checklist
Sunset the Risk Heat Map: Formally ban the use of 5x5 ordinal risk matrices (Red/Yellow/Green) in board-level security reporting, replacing them with quantified VaR distributions.
Integrate CNAPP with FinOps Data: Feed your cloud security posture management (CSPM) telemetry into your FinOps data lake to mathematically calculate the revenue blast radius of every vulnerable node.
Baseline the Friction Penalty ($C_{friction}$): Audit the CI/CD pipeline to measure exactly how many hours per sprint are delayed by security scanning, establishing the baseline cost of developer friction.
Adopt a Monte Carlo Engine: Procure or build a quantitative risk modeling tool capable of running 10,000 simulations to calculate the true ALE ranges for your top 5 critical threat scenarios.
Deploy Automated Billing Circuit Breakers: Configure AWS Step Functions or GCP Cloud Functions to instantly revoke IAM permissions if a specific account's compute spend spikes >300% above its moving average.
Calculate $ROI_{mitigation}$ for Renewals: Before renewing any existing security vendor contract, force the CISO to provide the mathematical equation proving that the tool's ALE reduction exceeds its licensing and operational cost.
Isolate Unused Regions via SCP: Implement Organizational Service Control Policies that strictly deny all compute provisioning in hyperscaler regions the enterprise does not actively operate in, halting geographical resource hijacking.
Audit Security Compute Overhead: Run a Kubecost analysis specifically isolating the CPU/RAM requests of all security sidecars/DaemonSets to track the $CQRU$ and eliminate redundant agents.
Shift Left to Eliminate Friction: Aggressively move infrastructure vulnerability scanning into the GitHub/GitLab pull request phase to reduce the financial cost of remediating flaws in production.
Define the Risk Tolerance Break-Even ($RT_{be}$): Work with the CFO to establish the hard mathematical threshold where the enterprise will cease mitigating cyber risk and instead rely on cyber insurance or risk acceptance.
Stop guessing where your Kubernetes budget is going. Schedule a demo here to explore Kubernetes cost monitoring with Cloud Atler.