
1. Executive Synthesis
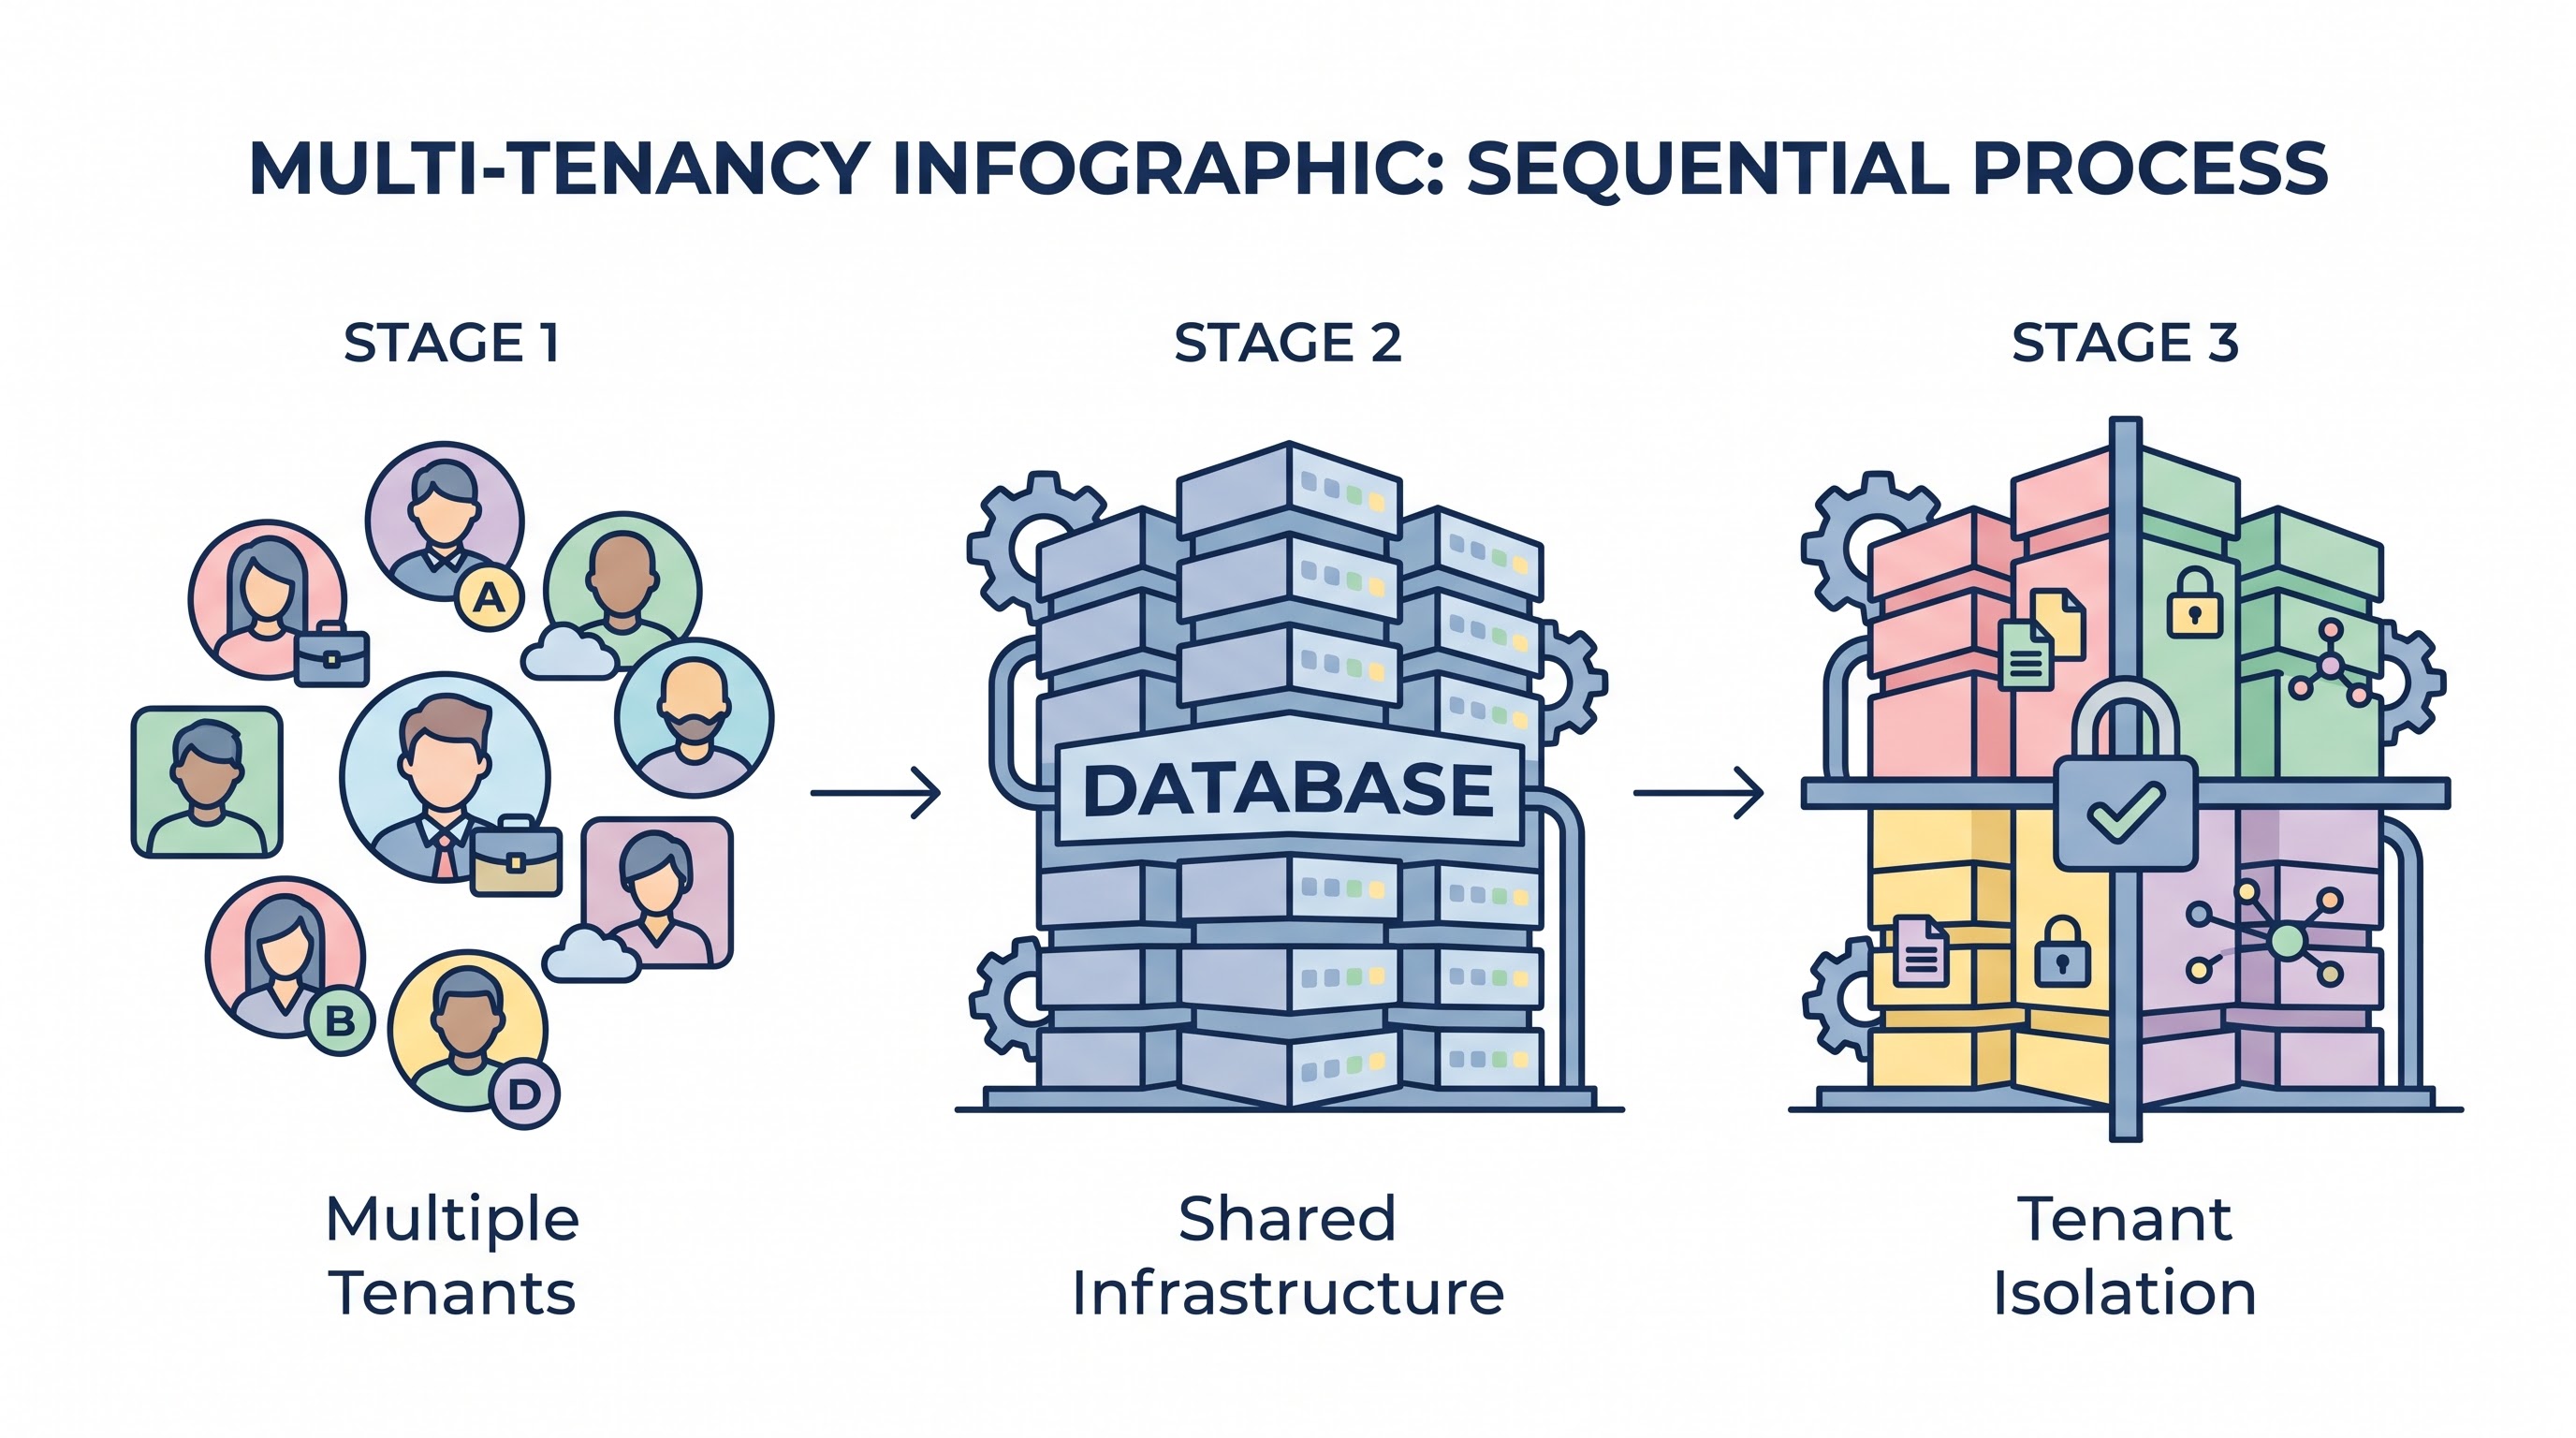
In the 2026 B2B SaaS landscape, the most critical determinant of gross margin is not the cloud compute tier, but the underlying multi-tenant data architecture. As SaaS platforms scale from SMBs to enterprise clients, the architectural requirements for data isolation fracture unit economics. The market forces a binary expectation: enterprise clients demand absolute cryptographic and physical data isolation (the "Silo" model) for compliance, while the SaaS provider requires massively shared infrastructure (the "Pool" model) to preserve 80% gross margins.
Attempting to force enterprise tenants into a Pooled model invites catastrophic regulatory rejection, while defaulting to a Silo model for all users creates thousands of isolated, massively underutilized database instances. This structural misalignment results in the "Isolation Premium"—the exponential increase in cloud infrastructure costs driven by idle database compute, redundant connection proxies, and exponentially compounding backup/snapshot storage.
To defend gross margins, SaaS architecture must transition to a mathematically governed hybrid state. This requires implementing the Multi-Tenant Arbitrage Model (MTAM). The MTAM dictates that database architecture is not a static engineering decision, but a dynamic financial routing matrix based entirely on the Annual Recurring Revenue (ARR) and specific compliance demands of the individual tenant.
By leveraging advanced Postgres Row-Level Security (RLS) for pooled efficiency and highly automated, orchestrated infrastructure-as-code for dedicated enterprise silos, FinOps leaders can programmatically allocate isolation strictly to the clients whose subscription tiers fund it. This playbook provides the rigorous financial mechanics required to map tenant ARR against cloud database ACUs (Aurora Capacity Units), enforce noisy-neighbor latency taxes, and structurally guarantee profitability across every tier of the SaaS customer base.
2. Market Gap & Search Intent Failure Analysis
Enterprise research regarding "SaaS Multi-Tenancy Architecture" typically yields software engineering tutorials focused on how to write Row-Level Security policies or how to shard databases. Search intent fails entirely to address the financial consequences of these architectural patterns at scale.
The structural market gap is the total omission of the Idle Isolation Tax. Analysts recommend the "Silo Model" for high security without warning the CFO that provisioning 1,000 isolated RDS instances for 1,000 tenants ensures that 95% of the database CPU across the fleet will sit entirely idle while still generating millions of dollars in monthly cloud invoices. Furthermore, generic guides ignore the "Noisy Neighbor Blast Radius." If a single tenant in a pooled database runs a poorly indexed analytical query, they can consume 100% of the I/O capacity, causing API timeouts for the other 9,000 tenants. Analysts fail to provide the mathematical models required to calculate when the financial risk of a pooled SLA breach exceeds the compute cost of migrating the offending tenant into an isolated database. This playbook eliminates this gap by quantifying the exact financial intersection of tenant isolation, SLA risk, and compute waste.
3. Core Strategic Framework
The enterprise must operationalize the Multi-Tenant Arbitrage Model (MTAM). This framework binds the SaaS product pricing tiers directly to the physical database routing architecture, ensuring zero leakage of infrastructure margins.
Implementation Protocol:
Tenant Profiling: Classify all SaaS tenants into three tiers based on ARR and compliance: Tier-3 (Standard/Pooled), Tier-2 (Bridge/Dedicated Schema), and Tier-1 (Enterprise/Dedicated Instance).
Execute the Isolation Premium (
$M_{iso}$) Test: Before an Enterprise sales contract is signed, the pre-sales engineering team must run the MTAM math to prove that the contracted ARR covers the dedicated database infrastructure with a$>75\%$gross margin.Automate the Pool-to-Silo Migration: Deploy an automated infrastructure pipeline (via Terraform/Crossplane). When a standard tenant upgrades to an Enterprise tier, the pipeline seamlessly forks their data from the Pooled Postgres cluster into a newly provisioned Dedicated RDS instance with zero human intervention.
Execution Decision Matrix:
If a Pooled Tenant consumes
$> 15\%$of the total shared database I/O for 3 consecutive days (Noisy Neighbor), execute an automated quarantine migration, moving them to a dedicated instance and flagging their account for immediate contract renegotiation.If an Enterprise Tenant requests Bring-Your-Own-Key (BYOK) encryption, they are mathematically forced into a strict Silo architecture, and the
$C_{tenant\_db}$baseline is multiplied by 2.5x to account for key broker integration costs.If the aggregate idle CPU of the Dedicated Silo fleet exceeds 60%, mandate an aggressive down-scaling of instance sizes (e.g., from r6g.large to t4g.medium) across all isolated tenants lacking strict high-availability SLAs.
4. Financial Modeling Layer (MANDATORY)
Defending SaaS gross margins requires explicit algorithmic control over tenant data infrastructure.
Core Equations
1. Fully Burdened Tenant Database Cost ($C_{tenant\_db}$):
Calculates the exact monthly cloud infrastructure cost to house a specific tenant, factoring in compute, storage, and backup retention.
$$C_{tenant\_db} = (P_{db\_compute\_hr} \times 730) + (V_{storage\_GB} \times P_{gb\_mo}) + \left( \sum_{d=1}^{30} V_{snapshot\_GB\_d} \times P_{backup\_gb} \right)$$Where:
$P_{db\_compute\_hr}$= The allocated hourly cost (100% of instance cost for Silo, or proportional share for Pooled).$V_{storage\_GB}$= Volume of active database storage consumed by the tenant.$V_{snapshot\_GB}$= Compounding volume of automated backups retained per compliance mandates.
2. Isolation Premium Margin ($M_{iso}$):
Quantifies the financial degradation incurred by offering a tenant dedicated database infrastructure instead of housing them in a shared pool.
$$M_{iso} = \left( \frac{R_{tenant\_mrr} - C_{tenant\_db\_silo}}{R_{tenant\_mrr}} \right) - \left( \frac{R_{tenant\_mrr} - C_{tenant\_db\_pool}}{R_{tenant\_mrr}} \right)$$Where:
$R_{tenant\_mrr}$= Monthly Recurring Revenue from the tenant.$C_{tenant\_db\_silo}$= Cost to host the tenant on isolated infrastructure.$C_{tenant\_db\_pool}$= Cost to host the tenant in a shared database.
3. Noisy Neighbor Latency Tax ($T_{noisy}$):
Calculates the financial liability of a pooled tenant consuming disproportionate resources and degrading the performance of other tenants on the same cluster.
$$T_{noisy} = \sum_{i=1}^{n} (N_{api\_timeouts\_i} \times P_{sla\_penalty}) + (L_{latency\_ms} \times R_{churn\_probability\_value})$$A) Sensitivity Analysis Table
This table models the Monthly Infrastructure Cost and resulting Gross Margin for a SaaS tenant paying $2,500/month, comparing architectural isolation models based on the tenant's raw data footprint (100 GB).
Isolation Architecture | Allocated Compute Cost | Storage & Backup Cost | Total Ctenant_db | Gross Margin on $2,500 MRR |
Pure Pool (Shared DB, RLS) | $15.00 (Proportional) | $12.00 | $27.00 / month | 98.9% (Highly Optimized) |
Bridge (Dedicated Schema) | $15.00 (Proportional) | $20.00 (Schema overhead) | $35.00 / month | 98.6% (Excellent Balance) |
Pure Silo (Dedicated RDS) | $350.00 (Minimum HA) | $45.00 (Isolated backups) | $395.00 / month | 84.2% (Acceptable for Ent.) |
Silo + BYOK + Multi-Region | $1,200.00 (Replication) | $150.00 (Egress & Storage) | $1,350.00 / month | 46.0% (Margin Destruction) |
Decision Threshold: If an Enterprise client demands Multi-Region Active-Active Silo isolation with BYOK, a $2,500/month contract results in a 46% margin, violating standard SaaS valuation metrics. The FinOps matrix dictates the minimum contract size for this architecture must be artificially raised to $7,000/month.
B) Break-Even Formula
The Tenant Silo Break-Even ARR ($ARR_{silo\_be}$) dictates the absolute minimum Annual Recurring Revenue a sales team is permitted to accept before agreeing to provision dedicated database infrastructure.
$$ARR_{silo\_be} = \frac{12 \times \left( C_{silo\_db\_compute} + C_{silo\_storage} + C_{ops\_maintenance} \right)}{1 - M_{target\_gross\_margin}}$$Numerical Example: A highly available dedicated Aurora cluster costs $400/mo. Isolated storage is $50/mo. Dedicated SRE maintenance overhead is allocated at $150/mo. Total monthly COGS = $600 ($7,200/yr). The corporate mandate is an 80% gross margin (0.80). $ARR_{silo\_be} = \$7,200 / (1 - 0.80) = \$7,200 / 0.20 = \$36,000\text{ ARR}$. If the sales team signs an Enterprise contract for $20,000 ARR with dedicated infrastructure, they have mathematically destroyed the company's unit economics.
C) Probability-Weighted Risk Table
Quantifying the operational and financial risks of multi-tenant architectures.
Scenario | Probability | Financial Impact | Weighted Exposure |
Cross-Tenant Data Leak (Pooled RLS Failure) | 1.5% / yr | $5,000,000 (Catastrophic Breach) | $75,000 per year |
Silo Fleet Patching Failure (Downtime) | 25.0% / yr | $40,000 (SLA Penalties) | $10,000 per year |
Noisy Neighbor IOPS Exhaustion (Pooled) | 60.0% / mo | $15,000 (Churn & Support Tix) | $9,000 per month |
Unmonitored Idle Silo Sprawl | 85.0% / yr | $120,000 (Wasted cloud compute) | $102,000 per year |
D) Cost-per-Unit Model
The central metric for SaaS data economics is the Cost Per Tenant Database Hour ($CPTDH$):
$$CPTDH = \frac{Total\_Fleet\_Database\_Cost\_(Silos + Pools)}{Total\_Active\_Tenants \times 730}$$Threshold: If $CPTDH$ exceeds $0.50 globally, the SaaS platform is suffering from severe Silo Sprawl. FinOps must mandate a freeze on deploying dedicated instances for any client under the $ARR_{silo\_be}$ threshold and aggressively pack mid-tier tenants into Bridge (Dedicated Schema) architectures.
5. Operational Architecture Integration
Row-Level Security (RLS) for Pooled Efficiency:
To achieve the 98% gross margins of the Pure Pool model, architecture must enforce strict logical isolation within a shared physical database (e.g., PostgreSQL). This requires implementing native Row-Level Security (RLS). Every table contains a tenant_id column. The application backend injects the authenticated tenant_id into the database session context variable upon connection. Postgres physically restricts SELECT, UPDATE, and DELETE operations at the engine level, guaranteeing that a tenant can never query another tenant's data. This achieves massive compute density (10,000 tenants on a single Aurora cluster) while maintaining rigorous compliance separation.
The "Bridge" Model (Dedicated Schemas):
For mid-market customers who require more isolation than RLS provides (e.g., the ability to restore their specific data to a point-in-time from a backup without affecting other tenants) but lack the ARR to justify a full Silo, architecture must deploy the Bridge Model. A single Postgres database cluster is provisioned, but each tenant receives their own dedicated SCHEMA. This allows the application to cleanly drop or backup a single tenant's schema independently, providing logical isolation while still multiplexing the underlying hardware compute (CPU/RAM) across hundreds of schemas.
Automated Quarantine & Fleet Orchestration:
Managing 1,000 dedicated Silos manually is an SRE nightmare. Architecture must utilize a control plane (e.g., Kubernetes operators or specialized platforms like AWS SaaS Factory). When a Pooled tenant triggers the performance degradation (Noisy Neighbor Tax) by locking table rows or exhausting IOPS, the control plane executes a zero-downtime logical replication pipeline. It dynamically spins up a dedicated RDS instance, streams the tenant's specific RLS data or Schema into the new instance, updates the application's connection router, and purges the tenant from the Pool, automatically resolving the in minutes.
6. Failure Scenarios
Scenario 1: The Silo-by-Default Margin Collapse
Breakdown: A B2B SaaS startup prioritizes "enterprise security" in their marketing and defaults to provisioning a dedicated AWS RDS Postgres instance for every new sign-up, regardless of contract size. They acquire 500 customers paying $50/month ($25,000 MRR).
Financial Exposure: 500 dedicated RDS instances (even t4g.small) plus storage and backups cost approximately $35,000/month. The company operates at a negative 40% gross margin purely on database infrastructure before factoring in application compute, payroll, or marketing.
Governance Prevention Layer: Sales & FinOps Gateway. Automated provisioning pipelines must be physically locked. The API call to CreateDBInstance is mathematically blocked unless the CRM webhook payload contains a verified Contract ARR
$> ARR_{silo\_be}$. All other sign-ups are hard-routed to the Pooled cluster.
Scenario 2: The Connection Limit Stampede
Breakdown: An enterprise scales its Pure Pool database to handle 20,000 tenants on a massive r6g.16xlarge Aurora instance. During peak morning login hours, 20,000 separate Lambda functions spin up to serve user requests. Each Lambda attempts to open a direct TCP connection to the database. Postgres runs out of connection slots, and the database crashes despite having 80% of its CPU sitting idle.
Financial Exposure: Total platform outage during peak hours, resulting in SLA violations across the entire customer base and extreme reputational damage.
Governance Prevention Layer: Mandatory Connection Multiplexing. Pooled multi-tenant databases are strictly prohibited from receiving direct application connections. All traffic must route through a fleet of PgBouncer instances or AWS RDS Proxy. This abstracts the 20,000 ephemeral application connections into a stable pool of 500 persistent database connections, mathematically preventing TCP exhaustion.
Scenario 3: The Cross-Tenant Point-in-Time Restore Failure
Breakdown: A SaaS platform uses a Pure Pool (RLS) model. A high-value tenant accidentally deletes a massive critical project and demands a Point-in-Time Restore (PITR) to exactly 2:00 PM yesterday.
Financial Exposure: Because the tenant shares the database with 9,999 other customers, the engineering team cannot simply restore the AWS RDS snapshot, as doing so would overwrite and destroy a day's worth of data for the other 9,999 customers. The team must manually mount the snapshot, write complex SQL to extract the specific tenant_id data, and manually patch it back into production—a process taking 48 hours and costing $15,000 in emergency engineering labor.
Governance Prevention Layer: Schema-Level Backup Architecture. For tenants paying for premium SLAs (including targeted restores), the platform must automatically route them to the Bridge (Dedicated Schema) architecture, enabling targeted pg_dump and restore procedures that isolate recovery without disrupting the broader tenant pool.
7. Board-Level Translation Layer
EBITDA Delta Modeling: Database infrastructure is the most rigid, scaling cost in B2B SaaS. By transitioning a fragmented, Silo-heavy architecture into a highly dense, RLS-driven Pooled architecture, a SaaS company can slash its database COGS by 85%. For a $50M ARR company, this directly recovers millions of dollars into EBITDA, massively expanding the valuation multiple of the business.
Gross Margin Defense: The board must understand that offering "Dedicated Databases" is not a software feature; it is an infrastructure liability. The MTAM framework enforces that this liability is only assumed when the customer explicitly funds it via high-tier ARR. This physically prevents the sales team from discounting away the company's cloud margins to close enterprise deals.
Capital Allocation Signal: A rising Cost Per Tenant Database Hour (
$CPTDH$) signals to the CFO that the engineering architecture is scaling inefficiently. It dictates that capital should be paused on new feature development and heavily allocated to refactoring the data access layer to support high-density pooling, otherwise future revenue growth will be consumed entirely by hyperscaler database bills.Risk-Adjusted ROI Formula:
$$ROI_{multi\_tenant} = \frac{\text{Eliminated Idle Silo Compute} + \text{Saved Database Licensing}}{\text{Engineering CapEx to Implement RLS} + C_{connection\_proxies}}$$
8. Data Visualization Suggestions
Multi-Tenant Arbitrage Matrix: A scatter plot mapping all customers. X-axis is Contract ARR, Y-axis is Total Database Storage (GB). A vertical red line represents the
$ARR_{silo\_be}$. Customers to the left of the line demanding Silos are highlighted in red (Unprofitable), triggering renegotiation alerts.Silo CPU Waste Histogram: A histogram showing the average CPU utilization across 1,000 Dedicated Silo databases. A massive peak at the 1%-5% utilization mark visually proves to the board the catastrophic waste generated by over-provisioning dedicated hardware.
Noisy Neighbor Auto-Quarantine Flow: An architectural diagram showing a Pooled DB with a single tenant's IOPS spiking red. An automated Kubernetes operator detects the spike, spins up a fresh isolated DB, streams the data, and reroutes the traffic, restoring the Pool to green.
Database COGS Waterfall: A waterfall chart showing the $50,000 monthly cost of a Silo-only strategy, stepping down drastically to $8,000 as 90% of tenants are migrated to RLS Pools, leaving a highly optimized, dense infrastructure footprint.
Tenant Migration Pipeline: A timeline showing the CI/CD steps required to move a customer from Pool -> Bridge -> Silo seamlessly as they upgrade their subscription tier, proving architectural liquidity.
9. Why Analyst-Style Summaries Fail at Financial Precision
When software analysts state, "B2B SaaS companies must adopt a multi-tenant architecture to scale, utilizing tenant isolation to balance security and performance," they are dispensing high-level philosophy that lacks mathematical execution.
This narrative fails because "balancing security and performance" is an unquantifiable platitude. If an Enterprise Architect follows this advice without calculating the Tenant Silo Break-Even ARR ($ARR_{silo\_be}$), they will succumb to enterprise sales pressure and deploy dedicated databases for mid-market clients, mathematically ensuring the company loses money on every contract.
Equation-backed modeling using the Multi-Tenant Arbitrage Model (MTAM) replaces vague architectural philosophy with hard financial boundaries. It calculates the exact Isolation Premium Margin ($M_{iso}$) to the penny. It forces the CTO and CFO to agree that isolation is a premium commodity, governed by strict revenue thresholds. You cannot architect a profitable SaaS platform on qualitative security guidelines; you architect it by weaponizing database density and ruthlessly punishing infrastructure waste.
10. Strategic Conclusion
The database layer of a multi-tenant SaaS application is the ultimate battleground for gross margins. The tension between enterprise compliance demands (which drive isolation) and cloud unit economics (which demand extreme density) creates a continuous threat to operational profitability. Treating multi-tenancy as a static, one-size-fits-all engineering decision is a fatal error in 2026.
To defend corporate valuations, FinOps and Engineering leadership must implement the Multi-Tenant Arbitrage Model (MTAM). The enterprise data architecture must become a fluid, financially routed matrix. High-density, Row-Level Security (RLS) Pools must be the absolute default, capable of absorbing tens of thousands of standard tenants at a fractional cost. Bridge schemas and Dedicated Silos must be fiercely protected behind mathematical ARR gateways.
Furthermore, this architecture cannot be managed manually. The platform must possess the automated orchestration to instantly quarantine noisy neighbors and dynamically migrate upgrading tenants across isolation tiers with zero downtime. By rigorously calculating the cost of isolation and binding the infrastructure topology directly to the SaaS pricing model, the enterprise mathematically guarantees that cloud costs scale sub-linearly to revenue, permanently securing the elite gross margins required by the public markets.
11. Implementation Readiness Checklist
Calculate the
$ARR_{silo\_be}$Threshold: Run the exact financial math on your cloud database provisioning costs to determine the absolute minimum subscription revenue required to justify a dedicated instance.Audit Silo CPU Utilization: Scan all existing dedicated tenant databases. Identify instances with
$<10\%$average CPU utilization over 30 days and flag them as prime candidates for down-sizing or migration to a Shared Pool.Implement Row-Level Security (RLS): Refactor the backend ORM (Object-Relational Mapping) layer to seamlessly inject tenant_id contexts into all database sessions, enforcing cryptographic-level logical isolation at the Postgres engine layer.
Deploy Connection Multiplexing: Install PgBouncer, ProxySQL, or AWS RDS Proxy in front of all multi-tenant databases to physically protect the engines from TCP connection exhaustion caused by ephemeral application compute.
Automate Quarantine Pipelines: Build an infrastructure operator capable of executing an automated pg_dump/pg_restore or logical replication to seamlessly migrate a noisy tenant out of a shared pool into a dedicated environment.
Enforce Sales Contract Governance:FinOps database
$ARR_{silo\_be}$Architect Bridge Schemas: Standardize the deployment of Dedicated Schemas within shared databases for mid-tier customers, enabling targeted point-in-time restores (PITR) without disrupting the broader tenant pool.
Track the
$CPTDH$Metric: Integrate total database cloud spend and active tenant counts into the central FinOps dashboard, setting alerts if the Cost Per Tenant Database Hour begins to rise faster than top-line revenue.Standardize Instance Families: Force all Dedicated Silos onto ARM-based Graviton instances (e.g., r7g) to immediately capture a 20% price-performance advantage over legacy x86 architectures.
Implement Storage Auto-Scaling Limits: Configure strict maximum storage bounds on pooled databases. If a single tenant uploads massive binary payloads (e.g., files instead of references), the system must hard-limit their insert capability to prevent them from exhausting the shared disk volume.
Stop guessing where your Kubernetes budget is going. Schedule a demo here to explore Kubernetes cost monitoring with Cloud Atler.