
1. Executive Synthesis
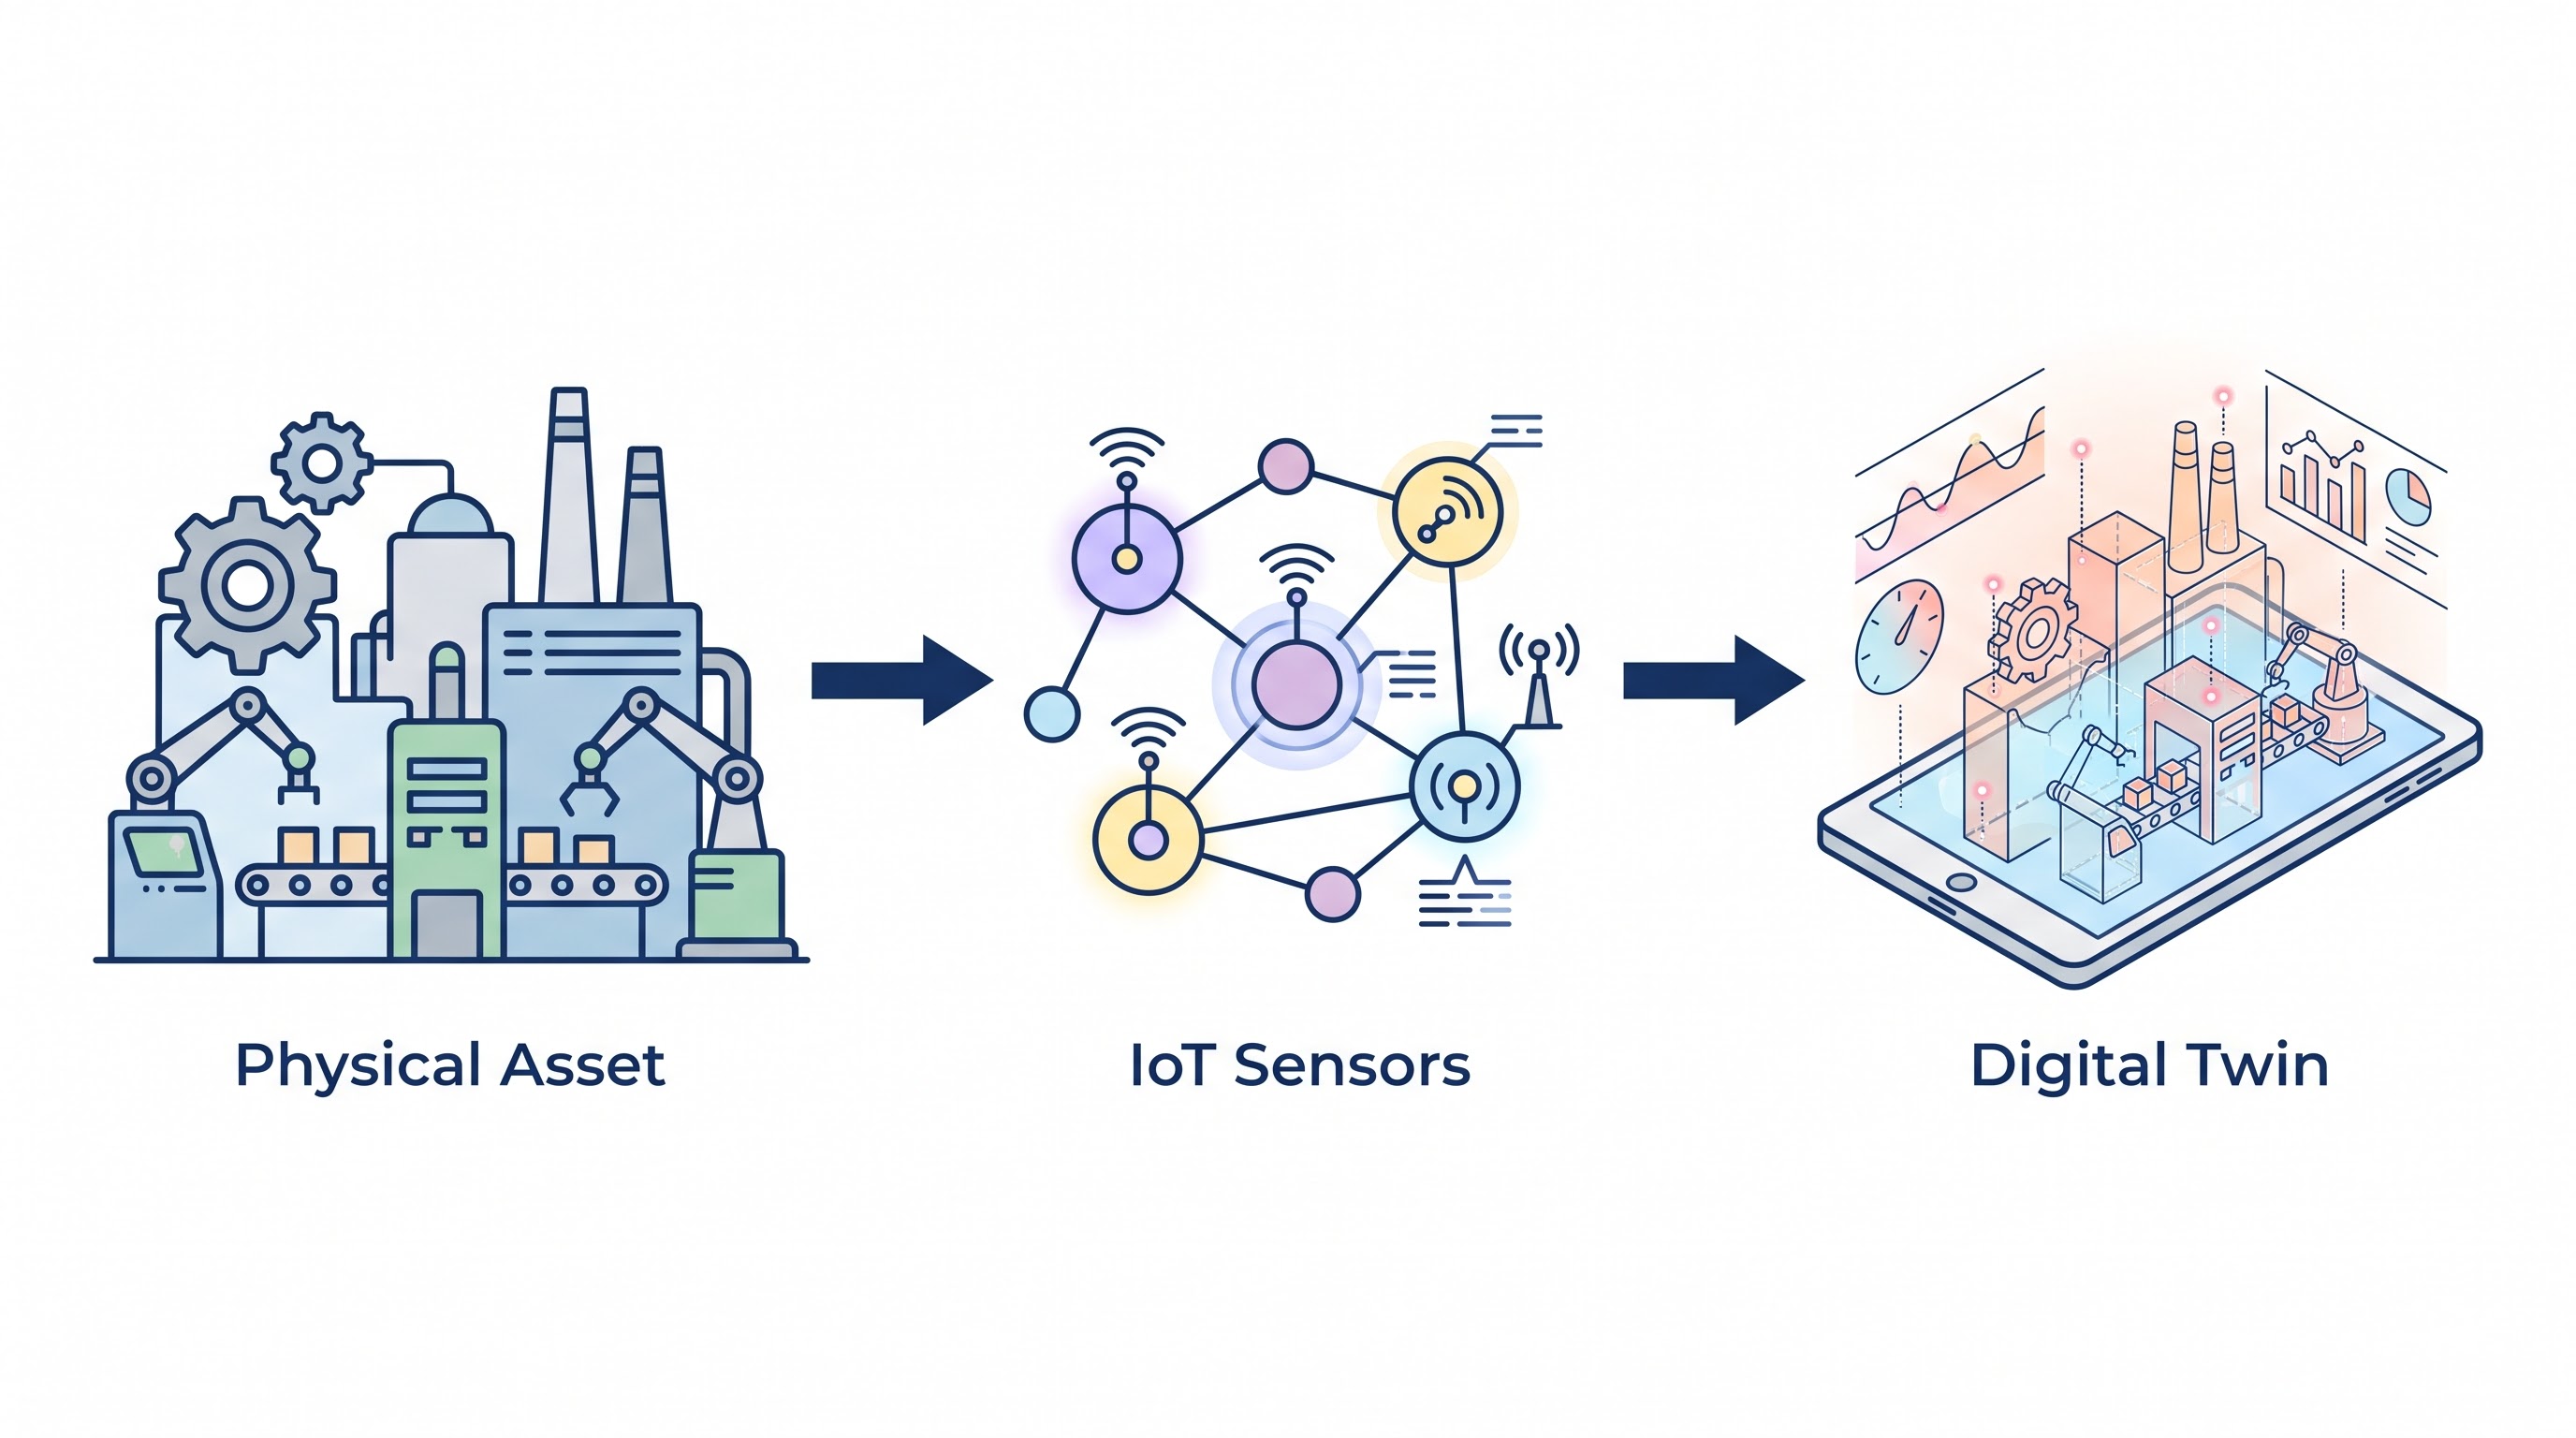
By 2026, spatial computing and industrial digital twins have crossed the threshold from experimental visualization projects into core operational infrastructure for manufacturing, logistics, smart cities, and complex aerospace engineering. Utilizing frameworks like OpenUSD (Universal Scene Description) and platforms like NVIDIA Omniverse or Unreal Engine, enterprises construct real-time, physics-accurate 3D replicas of physical assets. These digital twins ingest high-frequency telemetry from millions of Industrial IoT (IIoT) sensors, running continuous predictive simulations to optimize supply chain flows, prevent catastrophic machinery downtime, and enable remote robotic collaboration.
However, spatial computing introduces a severe, un-budgeted cloud infrastructure tax: Pixel Streaming and Ray-Tracing GPU Exhaustion. Unlike traditional 2D enterprise software where the client device (e.g., a browser or mobile app) executes the rendering workload locally, photorealistic real-time spatial computing relies on server-side GPU rendering. High-fidelity 3D frames are rendered in cloud data centers on high-end GPUs (e.g., NVIDIA L40S or A10G) and continuously streamed to end-user devices via ultra-low-latency WebRTC protocols.
When an enterprise deploys a digital twin platform to 1,000 factory floor operators or field engineers, every active concurrent user requires a dedicated or tightly constrained slice of a cloud GPU. An un-optimized WebRTC pixel streaming session can easily cost $2.50 to $6.00 per user hour in cloud compute and network egress. Operating this footprint 24/7 generates a catastrophic COGS profile that rapidly destroys the operational ROI of the industrial digital twin project.
To prevent spatial computing initiatives from collapsing under their own infrastructure weight, enterprise architects must deploy the Spatial Rendering Arbitrage (SRA) Framework. This framework treats 3D rendering and geometry processing as a dynamically tiered asset. The SRA framework dictates that spatial applications cannot default to continuous, un-cached server-side pixel streaming for all interactions.
By executing aggressive Level of Detail (LOD) compilation, shifting static geometry parsing to client-side WebGPU runtimes, and utilizing temporal frame-caching at the regional edge, the enterprise can collapse its server-side GPU rendering footprint by up to 75%. This playbook establishes the mathematical models required to balance real-time ray-tracing fidelity against cloud GPU compute tariffs, ensuring that enterprise spatial computing remains financially sustainable at scale.
2. Market Gap & Search Intent Failure Analysis
Enterprise research regarding "Digital Twin Costs" or "NVIDIA Omniverse FinOps" is severely polluted by 3D agency marketing and hardware vendor whitepapers. Search queries yield guides on how to optimize 3D polygon counts in Maya/Blender or how to set up basic WebRTC streaming servers. This technical literature completely fails to address the cloud financial mechanics of scaling spatial workloads across global enterprise footprints.
The critical market gap is the total failure to model the Concurrent Streaming Session Penalty. Hardware vendors sell spatial computing on the premise of photorealism, demonstrating massive 4K ray-traced simulations. However, they fail to warn the CFO that running a 4K WebRTC stream at 60 FPS requires an un-fractionalized high-end GPU instance per user, combined with massive, continuous cloud network egress.
Standard FinOps guides offer zero guidance on how to calculate the Frame Rendering Waste ($W_{frame}$)—the financial loss incurred when a cloud GPU renders 60 frames per second for a remote user who is currently looking at a static UI menu or standing idle. Analysts fail to provide the equations required to dynamically scale down rendering frame rates during idle user states. This playbook eliminates these blind spots, providing explicit mathematical models to govern spatial computing infrastructure costs.
3. Core Strategic Framework
The enterprise must operationalize the Spatial Rendering Arbitrage (SRA) Framework. This framework enforces financial discipline over 3D rendering pipelines, treating every frame rendered on a cloud GPU as a direct operational expense that must be mathematically justified by user interaction.
+-----------------------------------------------------------------------------------+
|                        SRA SPATIAL ROUTING PIPELINE                               |
+-----------------------------------------------------------------------------------+
                                          |
                                          v
                         +----------------------------------+
                         | Ingress User Request & Device    |
                         | Capability Profiling (WebGPU?)   |
                         +----------------------------------+
                                          |
                                          v
                         +----------------------------------+
                         | Evaluate Latency SLA & Required  |
                         | Ray-Tracing Photorealism Level   |
                         +----------------------------------+
                                          |
                                          v
                         +----------------------------------+
                         | Check Spatial Rendering Arbitrage|
                         | Test (SRA Matrix Execution)      |
                         +----------------------------------+
                                   /              \
                                  /                \
            Local WebGPU Capable /                  \ Low Client Power
                                /                    \ (Pixel Stream Req)
                               v                      v
              +----------------------------------+  +----------------------------------+
              | Client-Side WebGPU Execution     |  | Cloud GPU Pixel Streaming Cluster|
              | (Pull Compressed OpenUSD Mesh)   |  | (Dynamic FPS & Idle Foveated Ref)|
              +----------------------------------+  +----------------------------------+
Implementation Protocol:
Device Capability Profiling: Instrument the spatial application frontend to inspect the end-user's local hardware (checking for local WebGPU, Apple Metal, or discrete GPU capabilities) upon session initialization.
Execute Client-Side Offloading: If the client device possesses WebGPU capabilities, bypass cloud pixel streaming entirely. Compress the OpenUSD 3D asset into optimized Drako/GLTF geometry and stream the lightweight vector mesh to the client for local rendering.
Deploy Foveated & Adaptive Frame-Rate Streaming: For client devices requiring cloud pixel streaming, implement dynamic frame-rate throttling inside the WebRTC pipeline. If the user stops orbiting or moving the camera, instantly drop the cloud render rate from 60 FPS down to 5 FPS, preserving the static frame in the edge cache.
Execution Decision Matrix:
If Session State == Idle_Menu OR Static_Inspection, automatically throttle cloud GPU rendering to 1 FPS and freeze the WebRTC video pipeline.
If IIoT sensor telemetry frequency
$> 100\text{Hz}$, do not re-render the entire 3D mesh per telemetry tick. Buffer telemetry at the edge and execute batch mesh deformation updates every 1,000ms to bound GPU compute cycles.If S3 egress costs for streaming OpenUSD scene files exceed $0.05 per session, force the deployment of local regional edge caching nodes (e.g., Cloudflare Workers / AWS Local Zones) to serve static 3D assets.
4. Financial Modeling Layer (MANDATORY)
Governing the economics of spatial computing requires strict mathematical modeling of GPU allocation, rendering duration, and WebRTC streaming bandwidth.
Core Equations
1. Fully Burdened Pixel Streaming Cost ($C_{stream}$):
Calculates the exact hourly cost of providing a real-time pixel-streamed spatial computing session to a single user.
$$C_{stream} = (P_{gpu\_instance\_hr} \times \omega_{gpu\_slice}) + (V_{webrtc\_stream\_GB} \times P_{egress\_rate}) + \left( \frac{V_{usd\_asset\_GB} \times P_{s3\_storage}}{730} \right)$$Where:
$P_{gpu\_instance\_hr}$= Hourly cost of the cloud GPU instance (e.g., AWS g5.2xlarge).$\omega_{gpu\_slice}$= Fractional GPU assignment ratio (e.g., 0.5 if using vGPU partitioning like NVIDIA vComputeServer).$V_{webrtc\_stream\_GB}$= Volume of compressed WebRTC video data transmitted per hour (typically 4GB to 12GB/hr for 1080p/4K).$P_{egress\_rate}$= Outbound network data transfer rate per GB.
2. Spatial Decoupling Margin ($M_{spatial}$):
Determines the financial savings achieved by offloading geometry rendering to client-side WebGPU versus server-side cloud pixel streaming.
$$M_{spatial} = (C_{stream} \times H_{user\_session\_hrs}) - \left( V_{compressed\_mesh\_GB} \times P_{cdn\_egress\_rate} + C_{edge\_asset\_caching} \right)$$3. Frame Rendering Waste ($W_{frame}$):
Quantifies the direct financial loss incurred by rendering static, un-changed frames on expensive cloud GPUs during user idle states.
$$W_{frame} = \sum_{t=1}^{idle\_seconds} \left( \frac{FPS_{target} - FPS_{idle\_actual}}{FPS_{target}} \right) \times \left( \frac{P_{gpu\_instance\_hr}}{3600} \right)$$A) Sensitivity Analysis Table
This table models the Monthly TCO for a enterprise digital twin platform supporting 500 concurrent industrial users (totaling 80,000 user hours per month), comparing spatial rendering architectures.
Spatial Architecture Strategy | Cloud GPU Compute Cost | Network Egress Cost | Total Monthly TCO | FinOps Recommendation |
Pure Un-cached Pixel Streaming (4K 60FPS) | $180,000 / month | $64,000 / month | $244,000 / month | Financially Unviable COGS |
Throttled Streaming (Adaptive FPS) | $72,000 / month | $25,000 / month | $97,000 / month | 60% Margin Recovery |
Hybrid SRA (WebGPU + Edge Asset Caching) | $18,000 / month | $4,500 / month | $22,500 / month | Mandatory Enterprise Standard |
Decision Threshold: Operating a pure, un-cached 4K pixel streaming architecture for a large workforce results in a $244,000 monthly cloud bill. By executing the SRA framework—offloading compatible client sessions to WebGPU and dynamically throttling server-side frame rates during idle states—the enterprise slashes TCO down to $22,500/month (a 90% reduction).
B) Break-Even Formula
The Client-Side WebGPU Migration Break-Even ($H_{webgpu\_be}$) calculates the minimum number of streaming user hours required to justify the engineering CapEx of refactoring a server-side C++ 3D rendering pipeline into a lightweight WebGPU/TypeScript architecture.
$$H_{webgpu\_be} = \frac{CapEx_{webgpu\_refactor\_engineering}}{C_{stream\_per\_hour} - (V_{mesh\_download\_GB} \times P_{cdn\_rate})}$$Numerical Example: Refactoring a proprietary Omniverse C++ rendering pipeline to run client-side in browser WebGPU costs $120,000 in engineering labor. The server-side pixel streaming cost ($C_{stream}$) is $3.00/hour. Downloading the compressed 3D mesh via CDN costs $0.05 one-time per session (assuming average session is 2 hours, so $0.025/hr). The net savings per user hour is $2.975. $H_{webgpu\_be} = \$120,000 / \$2.975 = 40,336\text{ streaming user hours}$. If the enterprise workforce utilizes the digital twin for more than 40,336 aggregate hours, the WebGPU refactor mathematically pays for itself.
C) Probability-Weighted Risk Table
Quantifying the operational and financial risks of spatial computing infrastructure.
Scenario | Probability | Financial Impact | Weighted Exposure |
WebRTC Egress Spike (Un-throttled 4K Stream) | 50.0% / mo | $35,000 (Network bill shock) | $17,500 per month |
GPU Instance Shortage (Capacity Block Preemption) | 20.0% / yr | $150,000 (Factory floor downtime) | $30,000 per year |
OpenUSD Asset Bloat (Uncompressed 3D Geometry) | 65.0% / proj | $25,000 (Storage/Egress waste) | $16,250 per project |
High-Frequency IIoT Ingestion Storm | 30.0% / mo | $12,000 (Database/Compute burn) | $3,600 per month |
D) Cost-per-Unit Model
The central metric for Spatial Computing Operations is the Cost Per Spatial Session Hour ($CPSH$):
$$CPSH = \frac{Total\_Cloud\_GPU\_OpEx + WebRTC\_Egress + Asset\_Storage}{Total\_Active\_User\_Interaction\_Hours}$$Threshold: If $CPSH > \$0.80$, the spatial computing platform is operating with extreme compute waste. FinOps must mandate immediate implementation of foveated rendering, WebGPU offloading, or aggressive vGPU slicing.
5. Operational Architecture Integration
vGPU Partitioning & Kubernetes Acceleration (NVIDIA MPS / vComputeServer):
Dedicating an entire physical GPU (e.g., an NVIDIA A10G) to a single user who is inspecting a simple CAD model is a failure of resource allocation. Architecture must deploy GPU partitioning mechanisms. Utilizing NVIDIA Multi-Process Service (MPS) or GRID vGPU software inside Kubernetes (EKS/GKE), the spatial platform can partition a single physical GPU into 4 or 8 virtual GPU (vGPU) slices. Multiple WebRTC pixel streaming containers execute concurrently on the same physical card, sharing VRAM and compute execution contexts. This increases hardware density, immediately reducing $P_{gpu\_instance\_hr}$ by up to 75% per user session.
OpenUSD Scene Graph Optimization & Draco Compression:
3D models generated by industrial CAD tools (CATIA, SolidWorks) are notoriously un-optimized, containing millions of redundant vertices and high-resolution textures that burn VRAM and storage. Architecture must enforce a spatial CI/CD optimization pipeline. Before an OpenUSD scene graph is published to production, an automated pipeline (utilizing tools like Simplygon or MeshLab) executes Draco mesh compression, texture down-sampling (converting uncompressed PNGs to KTX2/BASIS formats), and automated Level of Detail (LOD) generation. This compresses a 10GB raw CAD file down to a 250MB optimized OpenUSD asset, dropping both S3 storage costs and WebRTC loading times.
Edge-Based WebRTC Proxy & Pixel Caching:
To minimize network latency and prevent long-distance network egress fees, WebRTC streaming servers must not sit exclusively in central cloud regions. Architecture must deploy a hub-and-spoke rendering topology. The heavy physical simulation and IIoT data aggregation occur centrally, while lightweight, regional WebRTC streaming proxies sit at the edge (e.g., AWS Local Zones or Equinix Metal edge nodes) physically close to the industrial facilities. If 20 field engineers in the same factory are viewing the exact same static scene, the edge proxy renders the frame sequence once and multi-casts the WebRTC video stream, dropping network egress costs exponentially.
6. Failure Scenarios
Scenario 1: The "Always-On" Omniverse Cluster
Breakdown: An industrial engineering team sets up a massive NVIDIA Omniverse Nucleus and rendering cluster on AWS using g5.12xlarge instances to power a digital twin of an assembly plant. They leave the cluster running 24/7 so that field technicians can log in whenever needed.
Financial Exposure: A g5.12xlarge costs approximately $5.67/hour. Running a cluster of 10 nodes 24/7 costs $40,824 per month. Over the course of a year, the enterprise burns $489,888 on infrastructure that sits 80% idle during nights and weekends.
Governance Prevention Layer: Automated Idle Suspension & Karpenter Scale-to-Zero. Spatial rendering clusters must be governed by strict activity-based autoscaling. If zero WebRTC sessions are active for 15 minutes, Karpenter automatically drains the GPU worker nodes and scales the cluster down to zero, utilizing lightweight serverless warmers to re-provision GPU capacity only when an incoming user authenticates.
Scenario 2: The Uncompressed CAD Ingestion Flood
Breakdown: An architectural firm ingests un-optimized BIM (Building Information Modeling) files directly into their spatial application. A designer uploads an uncompressed 15GB building file containing millions of hidden internal bolts and pipes. Every time a user opens the application, the cloud GPU attempts to parse the full 15GB uncompressed geometry into VRAM.
Financial Exposure: The VRAM instantly exhausts, causing GPU Out-Of-Memory (OOM) crashes. To fix the crashes, SREs scale the instance size up to massive, high-VRAM GPU nodes (p4d.24xlarge), driving instance costs up by 400% to accommodate un-optimized CAD files.
Governance Prevention Layer: Automated Geometry Linting & Ingestion Gates. Spatial asset pipelines must enforce hard geometry budgets. The ingestion pipeline must automatically scan incoming OpenUSD/CAD files. If the polygon count exceeds 5 million vertices or texture size exceeds 2GB without LOD optimizations, the pipeline physically rejects the upload, requiring the CAD designer to execute mesh reduction before cloud deployment.
Scenario 3: The 4K WebRTC Egress Disaster
Breakdown: To impress executive leadership, the spatial platform team configures default WebRTC pixel streaming to 4K resolution (3840x2160) at 60 FPS without spatial rate limiting. A cohort of 100 remote managers leaves the digital twin dashboard open on their secondary 4K monitors while working on other tasks.
Financial Exposure: A single 4K 60FPS WebRTC stream consumes ~25 Mbps of continuous bandwidth (~11.25 GB per hour). 100 idle users run streams for 8 hours a day = 9,000 GB of egress daily. At AWS public egress rates ($0.08/GB), the company burns $720 a day ($21,600/month) streaming pixels to monitors nobody is looking at.
Governance Prevention Layer: Foveated Rendering & Inactivity Window Detection. WebRTC pipelines must track browser focus and user input (mouse/keyboard/head-tracking). If the browser window loses focus, the edge proxy instantly pauses the video stream and drops bandwidth consumption to 0 Mbps.
7. Board-Level Translation Layer
EBITDA Delta Modeling: Industrial digital twins deliver immense operational value through predictive maintenance and reduced factory downtime. However, if cloud GPU rendering costs are unmanaged, the infrastructure OpEx will eclipse the operational savings. By deploying the SRA framework (WebGPU offloading and vGPU density), the enterprise slashes spatial compute COGS by 85%, ensuring that the digital twin initiative delivers a net-positive EBITDA expansion to the enterprise.
Gross Margin Defense: For B2B SaaS providers integrating 3D spatial visualization into their platforms (e.g., real-time supply chain maps or 3D asset tracking), server-side pixel streaming represents a severe margin threat. Enforcing client-side WebGPU execution as the default rendering tier guarantees that infrastructure COGS remains flat even as user engagement scales, preserving the 80% gross margin baseline.
Capital Allocation Signal: A high Cost Per Spatial Session Hour (
$CPSH$) indicates that the spatial initiative is operating with technical debt and un-optimized 3D assets. It signals to the CFO that capital must be directed toward building automated OpenUSD geometry compression pipelines and WebGPU client renderers rather than purchasing more cloud GPU capacity.Risk-Adjusted ROI Formula:
$$ROI_{spatial\_finops} = \frac{\text{Eliminated Cloud GPU \& Egress Waste} + \text{Avoided Physical Factory Downtime}}{CapEx_{webgpu\_refactor} + CapEx_{usd\_pipeline\_automation}}$$
8. Data Visualization Suggestions
Spatial Rendering Arbitrage (SRA) Flowchart: A decision-tree diagram showing an incoming user request evaluated for WebGPU client capability. Capable devices route left to cheap CDN Mesh downloads; non-capable devices route right to a vGPU-partitioned pixel streaming cluster with adaptive FPS throttling.
Pixel Streaming Cost vs. Frame Rate Curve: A graph plotting Frame Rate (FPS) on the X-axis against Monthly Cloud GPU + Egress Cost on the Y-axis. The steep curve visually highlights the massive cost spike between 30 FPS and 60 FPS, proving the financial necessity of adaptive throttling.
vGPU Density Optimization Waterfall: A visual waterfall chart taking an initial $10.00/hr dedicated GPU streaming cost per user and showing step-down reductions achieved by vGPU partitioning (-$7.50), Draco Mesh Compression (-$1.20), and Edge Asset Caching (-$0.50), netting an optimal $0.80/hr final unit cost.
OpenUSD Asset Size vs. VRAM Consumption Heatmap: A matrix plotting uncompressed 3D asset file sizes against the required GPU VRAM and resulting cloud instance cost, visually demonstrating why 3D geometry linting is mandatory for FinOps.
Spatial Session Unit Cost (
$CPSH$) Trend Line: A time-series chart tracking unit costs over a 12-month period as WebGPU offloading and idle suspension policies are introduced, showing a clear, permanent reduction in operational infrastructure costs.
9. Why Analyst-Style Summaries Fail at Financial Precision
When technology analysts state that "Industrial digital twins and spatial computing will revolutionize manufacturing by enabling real-time 3D simulation of physical assets," they are dispensing high-level operational vision while remaining totally blind to cloud infrastructure economics.
This narrative fails because it treats 3D rendering as a free software feature. An Enterprise Architect who follows this narrative and deploys un-cached, photorealistic pixel streaming across a global workforce will discover that the cloud GPU and WebRTC network egress bill rapidly exceeds the physical maintenance savings of the plant. Analysts do not calculate the Fully Burdened Pixel Streaming Cost ($C_{stream}$) or the Frame Rendering Waste ($W_{frame}$).
Equation-backed modeling using the Spatial Rendering Arbitrage (SRA) framework destroys this operational blind spot. By calculating the Client-Side WebGPU Migration Break-Even ($H_{webgpu\_be}$), FinOps leaders force 3D software engineers to respect the laws of cloud economics. It mathematically proves that you cannot stream raw, un-throttled pixels to remote users without destroying gross margins. You do not scale enterprise spatial computing by buying bigger cloud GPU clusters; you scale it by ruthlessly compressing geometry, offloading rendering to client devices, and mathematically capping frame rates during idle user states.
10. Strategic Conclusion
Spatial computing, OpenUSD, and industrial digital twins represent the next major evolution in enterprise software, bridging the gap between physical operations and digital intelligence. However, the physical reality of rendering high-fidelity 3D geometry requires an unprecedented volume of cloud GPU compute and ultra-low-latency network bandwidth. Treating spatial computing as just another web application will lead to catastrophic infrastructure bill shock and the premature cancellation of high-value digital transformation initiatives.
To achieve financial sustainability, enterprise leadership must mandate the Spatial Rendering Arbitrage (SRA) Framework. The architecture must become aggressively price-aware. The default operational mode for spatial applications must shift from expensive, server-side pixel streaming to lightweight, client-side WebGPU execution wherever hardware capabilities allow.
When server-side rendering is strictly required, the infrastructure must be relentlessly optimized. Cloud GPUs must be partitioned using vGPU technologies to maximize multi-tenant session density. WebRTC video streams must be governed by dynamic, foveated frame-rate throttling that instantly kills compute waste during idle user states. Furthermore, 3D geometry pipelines must enforce hard polygon and texture budgets before assets are published to production. By governing spatial computing through strict mathematical and financial constraints, FinOps leaders ensure that the enterprise captures the revolutionary operational power of digital twins while permanently defending its corporate bottom line.
11. Implementation Readiness Checklist
Calculate the Baseline
$CPSH$: Audit all cloud invoices to isolate GPU instance spend and WebRTC egress specifically tied to 3D rendering, establishing your baseline Cost Per Spatial Session Hour.Enforce vGPU Partitioning: Re-architect cloud GPU rendering clusters (EKS/GKE) to utilize NVIDIA MPS or vGPU software, splitting physical GPUs into 4 or 8 virtual slices to maximize user session density.
Implement WebGPU Capability Profiling: Update the frontend spatial application to detect client-side WebGPU support upon initialization, automatically routing capable devices to client-side rendering pathways.
Deploy Automated Geometry Compression: Build an automated CI/CD pipeline step (using Draco/MeshLab) that compresses raw CAD/OpenUSD files, enforcing strict limits on polygon counts (
$<5\text{M}$vertices) and texture sizes.Code Adaptive WebRTC Frame Throttling: Program the streaming engine to monitor user input. If zero camera movement is detected for 5 seconds, dynamically drop the cloud render rate from 60 FPS to 1 FPS.
Audit WebRTC Network Egress Rates: Review cloud network billing to ensure pixel streaming servers are deployed in regions with heavily discounted egress or connected directly to Private Network Interconnects (PNIs).
Implement Scale-to-Zero GPU Clusters: Configure Karpenter to automatically terminate idle GPU worker nodes when zero active WebRTC sessions are detected for more than 15 minutes.
Deploy Edge Asset Caching: Set up regional edge caching nodes (Cloudflare Workers / AWS Local Zones) to serve static OpenUSD scene graphs and textures, preventing long-distance S3 egress fees.
Calculate the
$H_{webgpu\_be}$Threshold: Run the break-even math to determine the exact number of user hours required to justify refactoring server-side C++ rendering pipelines into browser-native WebGPU code.Establish Geometry Budget Gates: Configure IaC pipelines to reject the deployment of any 3D asset file exceeding 500MB without explicit mathematical sign-off from the Lead Spatial Architect.
Stop guessing where your Kubernetes budget is going. Schedule a demo here to explore Kubernetes cost monitoring with Cloud Atler.