
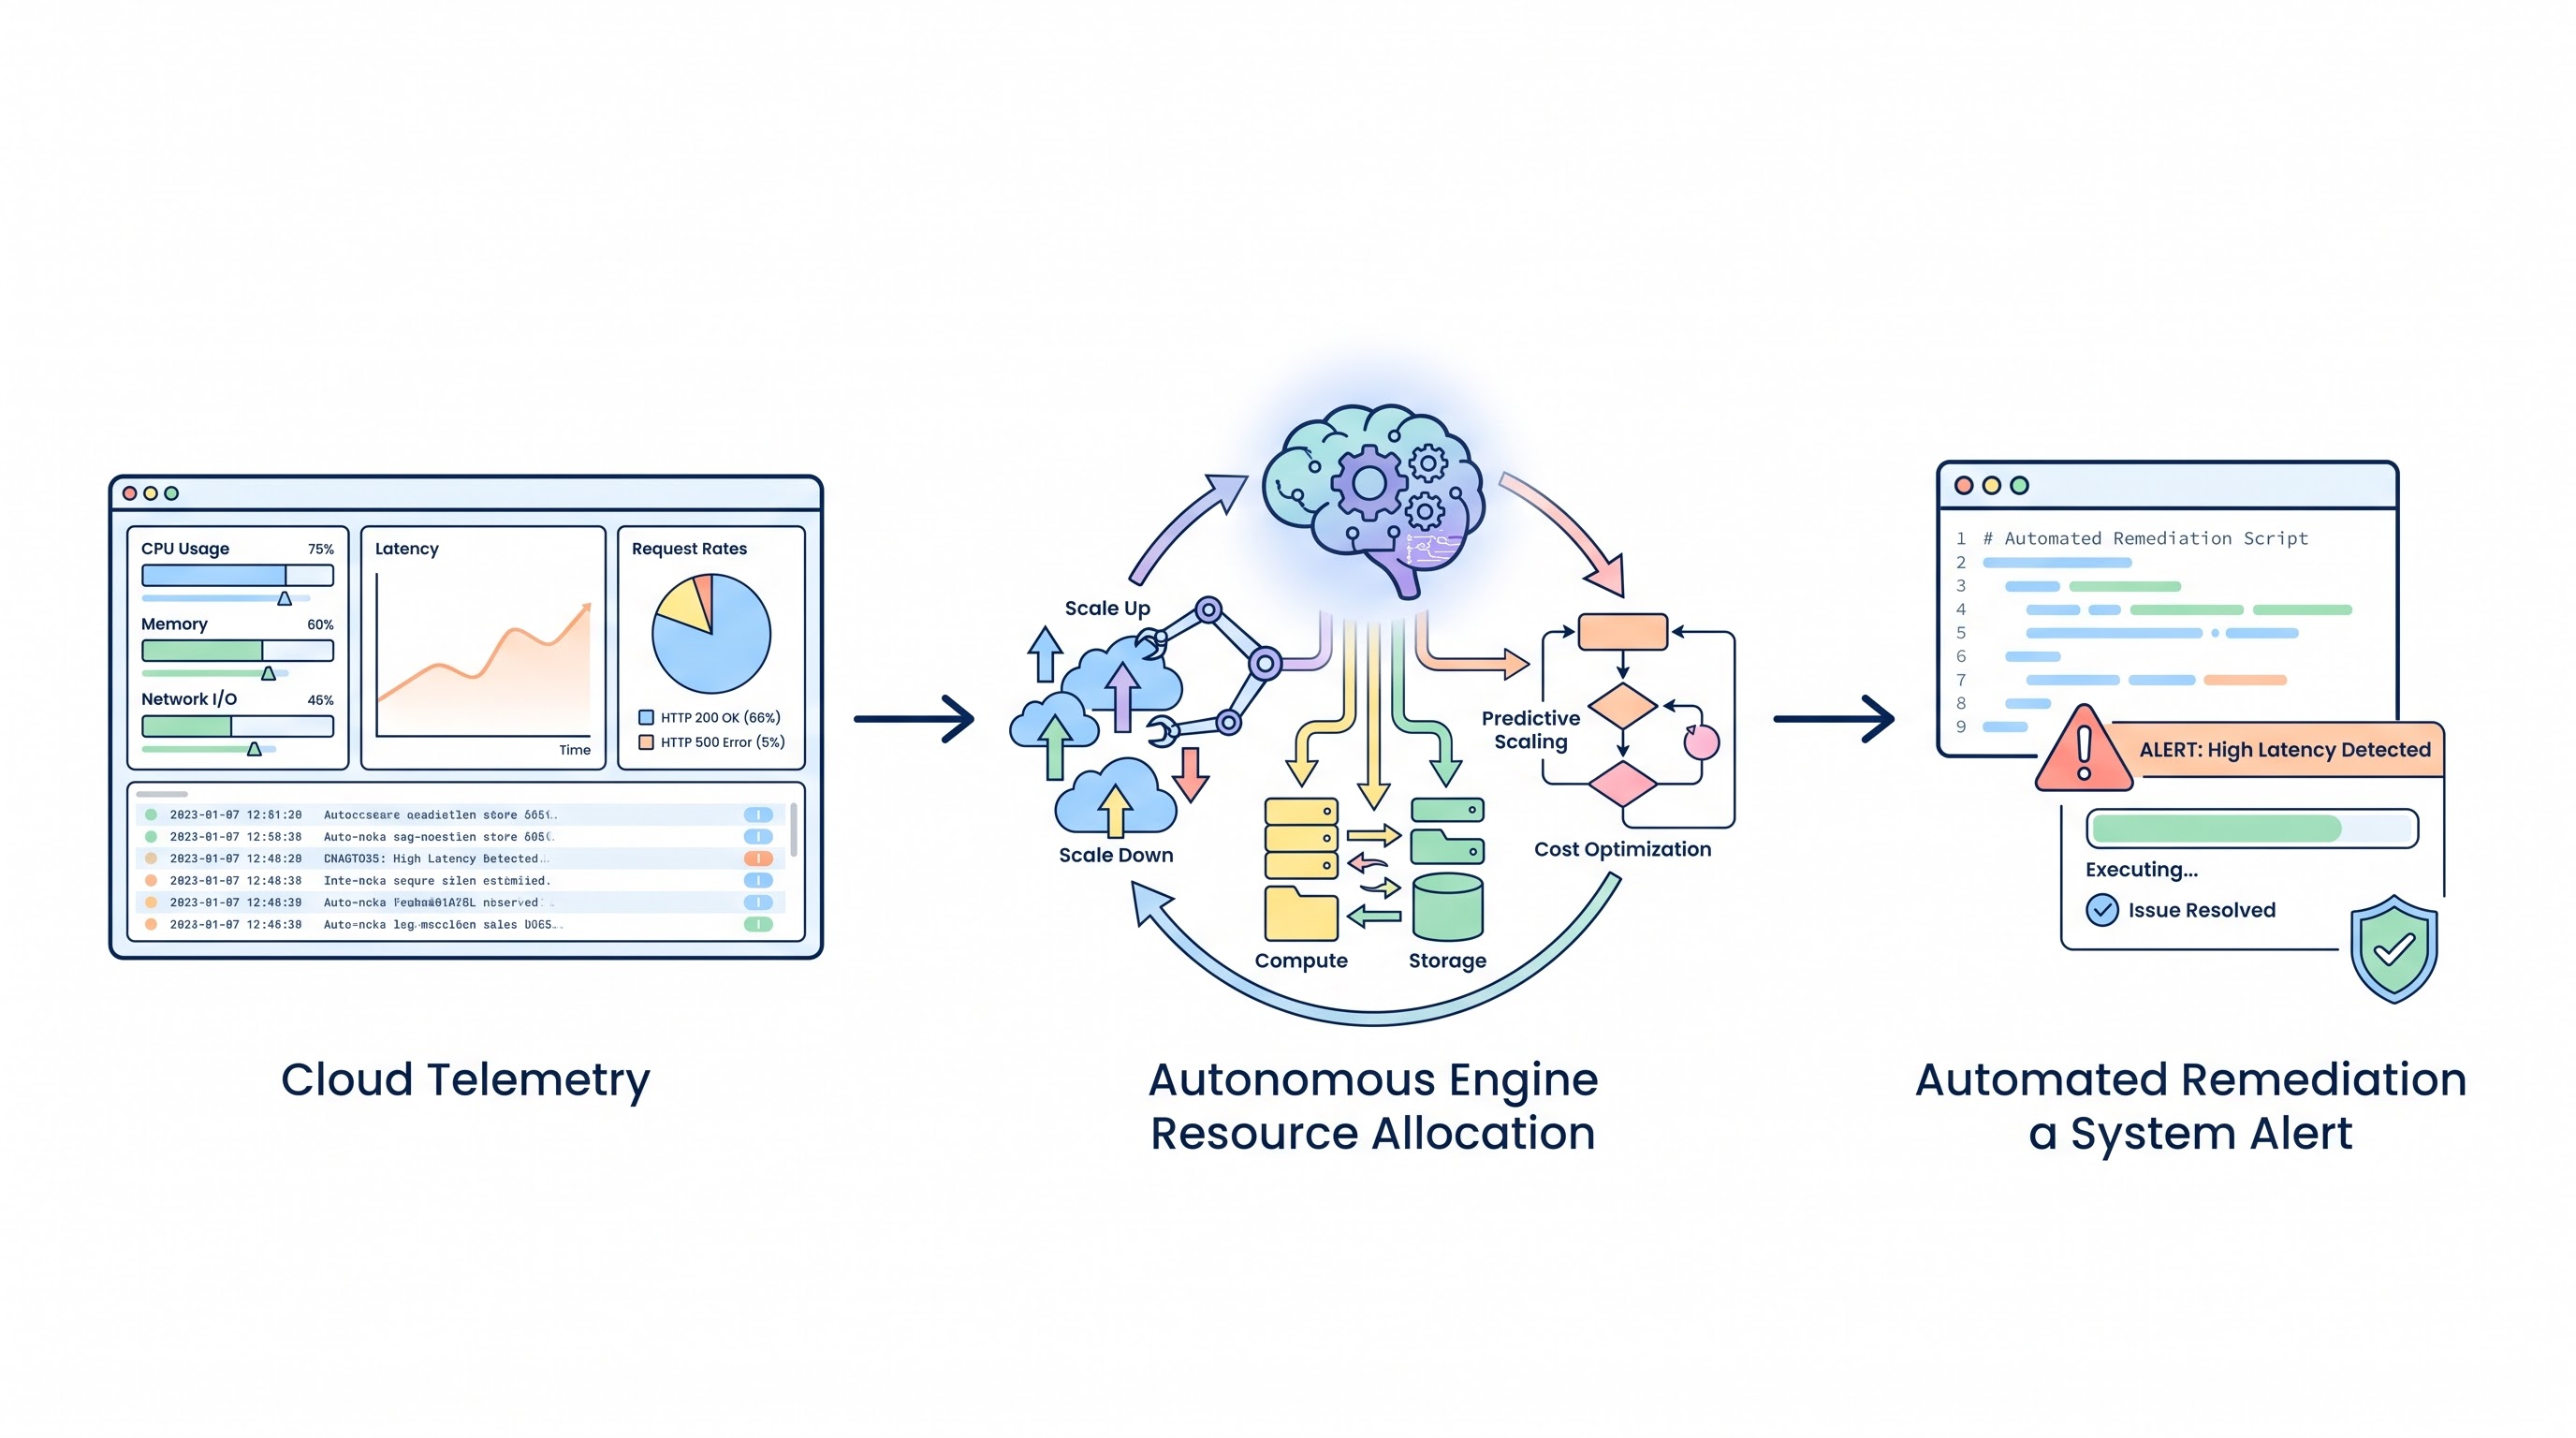
1. Executive Synthesis
The market for Cloud Financial Operations (FinOps) tooling has undergone a massive consolidation by 2026. The initial wave of FinOps startups built simple, monolithic dashboarding tools that aggregated cloud bills. However, modern enterprises demand agentic, proactive FinOps platforms—platforms capable of ingesting massive, multi-cloud FOCUS 1.2 billing datasets, executing autonomous remediation, and delivering highly elegant, board-level financial insights directly to the C-suite. Building a platform that satisfies these enterprise requirements, such as Atler Pilot, introduces a profound architectural and commercial challenge: the fundamental unit economics of processing client billing data at scale.
When a SaaS platform ingests an enterprise client's AWS Cost and Usage Report (CUR)—often generating billions of rows and terabytes of data per month—the compute and storage costs required to parse, normalize, and query that data can rapidly exceed the monthly subscription fee the client pays. If Atler Pilot charges a mid-market West Coast customer $5,000 a month, but spends $4,500 a month in Snowflake compute credits to process their data and generate anomaly reports, the SaaS gross margin collapses to a catastrophic 10%. Furthermore, executing a high-touch Go-To-Market (GTM) strategy—utilizing automated Apollo email sequences and LinkedIn outreach—adds a significant Customer Acquisition Cost (CAC) that must be rapidly amortized.
To successfully commercialize an enterprise FinOps platform, the executive team must implement the FinOps Platform Unit Economics (FPUE) Framework. This playbook dictates that the SaaS platform must decouple heavy data processing from its own balance sheet wherever possible. By leveraging zero-copy data sharing (e.g., Snowflake Secure Data Sharing) and executing asynchronous, highly cached analytical rollups, the platform shifts the compute burden while delivering lightning-fast, premium user experiences.
Equally critical is the presentation layer. The enterprise buyer expects absolute elegance. The architecture must support the automated generation of pixel-perfect, premium PDF reports and email templates that completely eschew robotic, placeholder-driven language. By mathematically balancing the backend data gravity costs with a highly optimized, human-centric GTM execution strategy, SaaS leaders can scale platforms like Atler Pilot to dominate the 2026 FinOps landscape while maintaining elite 85% gross margins.
2. Market Gap & Search Intent Failure Analysis
Enterprise research regarding "How to build a SaaS platform" or "SaaS Unit Economics" is heavily generalized, focusing on standard CRUD (Create, Read, Update, Delete) applications. Search intent yields advice on setting up Stripe billing, basic multi-tenant Postgres schemas, and writing generic outbound sales emails.
This generic advice is financially fatal when applied to a Big Data SaaS platform like a FinOps engine. The structural market gap is the total failure to model the Data Ingestion Margin Crush. Analysts do not explain that a single enterprise customer's AWS CUR file can contain more raw data than a standard SaaS platform's entire multi-tenant database. If a platform relies on traditional ELT (Extract, Load, Transform) to physically copy the client's billing data into the platform's own cloud environment, the network egress and storage costs will bankrupt the SaaS provider. Furthermore, GTM advice frequently advocates for high-volume, low-quality automated outreach, utilizing templates littered with obvious placeholders (e.g., Best, {{sender_name}}). This destroys brand equity when targeting elite West Coast CIOs. This playbook corrects these failures, providing the specific data architecture and GTM mathematics required to build a premium, highly profitable analytics product.
3. Core Strategic Framework
The enterprise must operationalize the FinOps Platform Unit Economics (FPUE) Framework. This framework treats client data ingestion, analytical compute, and GTM outreach as a unified financial equation that must be ruthlessly optimized for margin protection.
Implementation Protocol:
Zero-Copy Architecture Deployment: Abandon traditional data ingestion. Architect the platform (Atler Pilot) to utilize Snowflake Secure Data Sharing or Cross-Account IAM roles. The platform's analytical engine queries the client's billing data in place, inside the client's own data warehouse, shifting the heavy compute execution costs directly to the client's infrastructure.
Execute Analytical Rollup Caching: For data that must be processed internally, the platform never queries raw CUR data for dashboard loads. It utilizes a dbt DAG to execute a single, daily batch job that compresses billion-row tables into highly aggregated, normalized summary tables (FOCUS 1.2 format), ensuring sub-second Angular dashboard loads.
Deploy Premium GTM Automation: Configure the 6-step Apollo sequence and LinkedIn campaign strictly for "Test A / Test B" optimization targeting West Coast technical buyers. Mandate the absolute removal of all robotic placeholders (e.g., "Best wishes, Visha"). Enforce a highly human, consultant-level tone mapped directly to the buyer's identified cloud pain points.
Execution Decision Matrix:
If Client AWS Spend >$10M/yr, strictly forbid traditional data ingestion. Mandate Zero-Copy data sharing to prevent platform margin collapse.
If the automated PDF generation compute cost exceeds $1.50 per report, migrate the generation microservice from synchronous Lambda functions to asynchronous Spot-driven ECS containers.
If Apollo Sequence "Test A" (focusing on FinOps automation) yields a lower Cost Per Meeting (CPM) than "Test B" (focusing on Kubernetes costs), dynamically route 100% of the target cohort to the winning sequence within 72 hours.
4. Financial Modeling Layer (MANDATORY)
Scaling a FinOps platform requires explicit mathematical control over the Cost of Goods Sold (COGS) and Customer Acquisition Cost (CAC).
Core Equations
1. Platform Gross Margin Per Tenant (GMtenant): Calculates the true profitability of hosting a specific enterprise client on the Atler Pilot platform.
GMtenant=RmrrRmrr−(Cingestion_compute+Cstorage_gb+Cdashboard_api_compute)×100
Where:
Rmrr = The monthly subscription fee charged to the client.
Cingestion_compute = The cost of the daily batch jobs parsing the client's CUR files.
Cdashboard_api_compute = The serverless/container compute cost of serving the Angular frontend and generating PDF reports.
2. Zero-Copy Arbitrage Margin (Mzero_copy): Quantifies the financial savings generated by forcing the client to execute the heavy analytical compute within their own Snowflake/BigQuery environment rather than executing it on the SaaS platform's balance sheet.
Mzero_copy=(Vraw_rows×Pcompute_per_million_rows)−Csecure_share_overhead
3. GTM Sequence Acquisition ROI (ROIgtm): Determines the financial efficiency of the Apollo/LinkedIn outbound campaigns.
ROIgtm=Capollo_licensing+Csdr_labor_allocation(Nmeetings_booked×Rclose_rate×LTV)−(Capollo_licensing+Csdr_labor_allocation)
A) Sensitivity Analysis Table
This table models the Monthly COGS for a mid-market client generating 500GB of billing data per month, comparing data architectures against the platform's target $3,000 MRR.
Data Architecture Strategy | Ingestion & Storage Cost | Analytical Query Cost | Total COGS | Gross Margin on $3,000 MRR |
Traditional ELT (Copy All Data) | $800 (Network + Storage) | $1,500 (Heavy raw queries) | $2,300 | 23.3% (Margin Destruction) |
Aggregated Rollups (Daily Batch) | $300 (Storage of aggregates) | $150 (Fast dashboard queries) | $450 | 85.0% (Highly Profitable) |
Zero-Copy Data Sharing (Snowflake) | $0 (Client hosts data) | $50 (Lightweight API routing) | $50 | 98.3% (Maximum Leverage) |
Decision Threshold: Utilizing Traditional ELT for a Big Data SaaS platform guarantees negative or highly compressed margins. The architecture team is mathematically forced to implement Aggregated Rollups for smaller clients and Zero-Copy sharing for enterprise clients to maintain the 85%+ software valuation metric.
B) Break-Even Formula
The Outbound Sequence Payback Period (Ppayback_months) calculates the exact number of months a newly acquired West Coast client must remain subscribed to cover the fully burdened cost of the automated outreach campaign that acquired them.
Ppayback_months=Rmrr×(100GMtenant)(Nemails_sent×Rmeeting_conversion×Rclose_rateCcampaign_total)
Numerical Example: An Apollo campaign costs $5,000 to execute. It sends 10,000 emails, yielding a 0.5% meeting rate (50 meetings) and a 10% close rate (5 clients). The Customer Acquisition Cost (CAC) is $1,000 per client. The client pays $1,000 MRR with an 85% Gross Margin ($850 profit/month). Ppayback_months=$1,000/$850=1.17 months. The campaign is highly efficient and should be immediately scaled.
C) Probability-Weighted Risk Table
Quantifying the operational and GTM risks of a FinOps SaaS platform.
Scenario | Probability | Financial Impact | Weighted Exposure |
CUR File Format Change (Pipeline Breakage) | 25.0% / yr | $15,000 ( emergency labor) | $3,750 per year |
Runaway Client Query (Dashboard DDoS) | 40.0% / mo | $4,000 (Snowflake compute spike) | $1,600 per month |
Spam Filter Blacklisting (Robotic templates) | 15.0% / qtr | $35,000 (Lost sales pipeline) | $5,250 per quarter |
PDF Generation Memory Leak (OOM Crash) | 10.0% / mo | $5,000 (SLA breach / Support) | $500 per month |
D) Cost-per-Unit Model
The central metric for the platform is the Cost Per Analyzed Dollar (CPAD):
CPAD=Total_Client_Cloud_Spend_AnalyzedTotal_Platform_Infrastructure_COGS
Threshold: If CPAD exceeds $0.001 (i.e., it costs the platform $1 to analyze $1,000 of client cloud spend), the data ingestion pipeline is fundamentally bloated. Engineering must optimize the dbt models to skip non-actionable billing line items (e.g., zero-cost internal networking traces) to compress the processing footprint.
5. Operational Architecture Integration
Zero-Copy FinOps Architecture: To achieve the 98% gross margin target, Atler Pilot must utilize modern data sharing. Instead of extracting 10 Terabytes of AWS CUR data from a Fortune 500 client, Atler Pilot acts as a connected application. If the client uses Snowflake, Atler Pilot utilizes Snowflake Secure Data Sharing. The client grants read-only access to their billing view. The Atler Pilot analytical engine runs its proprietary cost-optimization algorithms against the data inside the client's Snowflake warehouse. The client absorbs the compute cost of the heavy analytical scan, while Atler Pilot simply retrieves the lightweight, aggregated output (e.g., "30 Idle EC2 instances found") to display in the Angular frontend.
Elegant PDF Generation Pipeline (Serverless Typography): Enterprise executives do not log into SaaS dashboards; they demand highly polished, elegant PDF reports delivered via email. Generating premium PDFs (requiring headless Chrome/Puppeteer to render complex Angular charts) is a massive memory and CPU burden. Architecture must decouple this from the primary API. When a report is requested, a message is dropped into an AWS SQS queue. A dedicated fleet of ECS Fargate Spot tasks picks up the queue, spins up headless browsers, renders the pixel-perfect identity of the Atler Pilot brand, strips all robotic placeholders, and uploads the compressed PDF to S3. This guarantees that heavy reporting tasks never degrade the sub-second latency of the live Angular application.
High-Velocity "Test A / Test B" GTM Automation: The Go-To-Market execution requires mathematical rigor identical to the cloud infrastructure. The Apollo outbound sequence is configured for strict A/B testing targeting West Coast technology buyers (CIOs, VP of Infra).
Test A focuses on "Agentic Automation"—highlighting zero-latency cost remediation.
Test B focuses on "Kubernetes TCO"—highlighting pod-level chargebacks. The sequence utilizes dynamic Webhook routing. When a prospect engages with an email, the webhook triggers a background process that enriches the prospect's CRM profile and immediately sequences a highly contextual, personalized LinkedIn connection request. The sequence completely bans the use of generic, lazy placeholders like Best, {{sender_name}} Cloud Atler or Best wishes, Visha, replacing them with hardcoded, premium, human-authored sign-offs to protect brand elegance.
6. Failure Scenarios
*Scenario 1: The "Select " Dashboard Bankruptcy
Breakdown: The Angular frontend is configured to allow clients to arbitrarily filter their cloud bill by any dimension (tag, region, instance type) over a 3-year period. Every time a user changes a dropdown, the backend API fires a massive SELECT * query with complex WHERE clauses directly against the raw billion-row billing table in Snowflake.
Financial Exposure: A single active user clicking through filters for 10 minutes can generate $50 in Snowflake compute credits. If 100 users do this, the platform burns $5,000 a day in pure analytical compute, instantly destroying the SaaS business model.
Governance Prevention Layer: Mandatory Materialized Aggregates. The backend API is mathematically prohibited from querying raw tables for synchronous user requests. All Angular dashboard queries must route exclusively to heavily pre-computed, daily materialized views. If a client requires arbitrary, deep-dive historical analysis, the UI must route the request to an asynchronous "Report Generation" queue, preventing live compute exhaustion.
Scenario 2: The Egress Ingestion Trap
Breakdown: A client agrees to use the platform but refuses Zero-Copy sharing, demanding that Atler Pilot ingest their data. The client's infrastructure is in Azure, but Atler Pilot is hosted in AWS. The engineering team sets up a daily pipeline to pull 500GB of Parquet files across the public internet.
Financial Exposure: The cross-cloud data transfer incurs massive Azure egress fees and AWS NAT Gateway processing charges, creating a permanent structural tax on the client's profitability.
Governance Prevention Layer: Multi-Cloud Ingestion Endpoints. To prevent cross-cloud egress, the platform must deploy lightweight ingestion buckets natively in Azure, AWS, and GCP. The client drops the data into the native bucket in their own cloud (zero egress). Atler Pilot utilizes heavily optimized, compressed batch processing to summarize the data locally before transmitting the tiny summary payload across the internet to the primary AWS control plane.
Scenario 3: The Robotic Outreach Brand Destruction
Breakdown: The GTM team launches an aggressive Apollo sequence targeting 5,000 West Coast CISOs. Due to poor data hygiene and lazy template design, the emails go out with broken variables: Hi {{company_name}}, noticed you use AWS. Best, {{sender_name}} Cloud Atler.
Financial Exposure: The emails are instantly flagged by enterprise spam filters. The domain reputation is torched. The meeting booking rate drops to 0.0%, effectively wasting the entire $15,000 marketing campaign budget and permanently alienating key enterprise buyers who view the robotic tone as low-tier and unprofessional.
Governance Prevention Layer: Strict Template Governance and Human-in-the-Loop QA. Apollo sequences must undergo a mandatory "Dry Run" utilizing a staging dataset. The marketing automation platform is configured to physically block the deployment of any template containing default fallback strings. All sequences must be reviewed by the Head of Sales to guarantee a premium, consultative tone before deployment.
7. Board-Level Translation Layer
EBITDA Delta Modeling: In Big Data SaaS, the architecture is the business model. If the platform ingests and processes all client data natively, EBITDA margins will hover around 20-30%. By enforcing the FPUE framework and utilizing Zero-Copy data sharing and pre-aggregated materializations, the platform shifts the compute burden off its balance sheet, mathematically guaranteeing an elite 85% gross margin. This transitions the company from a low-multiple IT services profile to a high-multiple, pure-play SaaS valuation.
Gross Margin Defense: Providing premium features, such as heavily customized, pixel-perfect PDF reports for board meetings, differentiates Atler Pilot from generic dashboard tools. However, executing this via synchronous Lambda functions destroys margins. Shifting this to asynchronous Spot-driven container fleets defends the gross margin while delivering the exact same premium enterprise experience.
Capital Allocation Signal: The A/B testing data from the Apollo sequences provides instant capital allocation signals. If "Test B" (Kubernetes TCO) yields a Customer Acquisition Cost (CAC) that is 40% lower than "Test A", the board must immediately redirect engineering CapEx toward building deeper Kubernetes FinOps features, aligning product development perfectly with market acquisition efficiency.
Risk-Adjusted ROI Formula:
ROIsaas_platform=CAC+Cingestion_compute+Cdashboard_api_computeLTV of Clients Acquired via Optimized GTM
8. Data Visualization Suggestions
Platform COGS Waterfall: A waterfall chart taking the theoretical $2,300 cost of processing a client's data via brute-force ELT, showing massive step-down deductions by applying Materialized Views, Serverless PDF Generation, and finally Zero-Copy Sharing, resulting in the actual $50 COGS.
GTM Sequence A/B Performance Matrix: A clean, dual-bar chart comparing "Test A" vs "Test B" across three metrics: Open Rate, Meeting Booked Rate, and CAC. A clear visual indicator flags the winning sequence for automated scaling.
Zero-Copy Architecture Topology: An architectural diagram showing the Atler Pilot SaaS AWS account on the left, and the Client's Snowflake account on the right. A secure data sharing bridge connects them, visually demonstrating that the heavy compute gears are turning strictly on the client's side of the perimeter.
Asynchronous PDF Generation Flow: A sequence diagram tracking a user clicking "Generate Board Report" in the Angular frontend. The request drops into an SQS queue, a cheap Spot instance wakes up, renders the elegant PDF using headless Chrome, and drops the finished file into S3, bypassing the main API entirely.
Cost Per Analyzed Dollar (CPAD) Trendline: A time-series graph tracking platform efficiency. As the platform scales from 10 clients to 100 clients, the line must curve downward, proving that the multi-tenant architecture is achieving economies of scale rather than linear compute bloat.
9. Why Analyst-Style Summaries Fail at Financial Precision
When generic SaaS analysts advise founders to "Focus on rapid customer acquisition and deliver a seamless, high-touch user experience," they are providing dangerous platitudes that routinely cause startups to scale into bankruptcy.
This narrative fails because it ignores the physical unit economics of Big Data. If an engineering team follows this advice and attempts to provide a "seamless experience" by allowing clients to run massive, real-time exploratory queries against billions of rows of raw billing data, the Snowflake compute bill will instantly exceed the company's revenue. Analysts do not calculate the Platform Gross Margin Per Tenant (GMtenant).
Equation-backed modeling using the FinOps Platform Unit Economics (FPUE) framework destroys this financial blindness. By calculating the exact Zero-Copy Arbitrage Margin (Mzero_copy), platform architects are mathematically forced to build asynchronous, heavily cached, or zero-copy data pipelines. Furthermore, by calculating the exact Outbound Sequence Payback Period (Ppayback_months), the GTM team is forced to abandon robotic, low-converting spam in favor of highly targeted, premium outbound execution. You do not build a successful enterprise platform with generic advice; you build it by ruthlessly balancing the physics of data gravity against the mathematics of customer acquisition.
10. Strategic Conclusion
Commercializing an enterprise FinOps platform in 2026 requires navigating a perilous financial intersection. The platform must process astronomical volumes of hyperscaler billing data while simultaneously delivering a flawless, elegant, and lightning-fast user experience to elite technical buyers. If the architecture relies on brute-force data ingestion and synchronous API compute, the resulting cloud bill will completely annihilate the SaaS gross margin.
To achieve dominance, the executive team must enforce the FinOps Platform Unit Economics (FPUE) Framework. The architecture must aggressively reject data gravity. By leveraging Zero-Copy data sharing and forcing heavy analytical compute back onto the client's infrastructure, platforms like Atler Pilot can scale infinitely without exposing their own balance sheet to volatile compute spikes. The presentation layer must follow suit—utilizing asynchronous Spot compute to generate premium, pixel-perfect reporting artifacts without dragging down the core API performance.
Equally, the Go-To-Market execution must reflect the elegance of the platform. Robotic, placeholder-driven outreach sequences destroy brand equity in the enterprise space. By executing mathematically rigorous, A/B-tested outbound campaigns tailored with a premium, consultative tone, the GTM team minimizes Customer Acquisition Cost (CAC) and accelerates the payback period. The synthesis of zero-gravity data architecture, decoupled presentation compute, and highly optimized commercial outreach mathematically guarantees that the platform captures market share while sustaining the elite unit economics that define premier enterprise software valuations.
11. Implementation Readiness Checklist
Mandate Zero-Copy for Enterprise: Configure the onboarding pipeline to physically disable raw data ingestion for any client whose cloud spend exceeds $10M/year, forcing the integration exclusively through Snowflake/Databricks secure sharing.
Calculate the Baseline GMtenant: Audit the Snowflake/AWS billing specifically tagged to individual tenants to calculate the exact gross margin of every active client, instantly flagging any accounts operating below 70% margin for architectural review.
Deploy Spot-Driven PDF Generation: Decouple all heavy reporting and PDF generation from the primary Node.js/Angular API. Route these requests to an SQS queue processed by a fleet of ECS Fargate Spot instances running headless browsers.
Implement Aggregated Materialized Views: Re-architect the backend database queries powering the Angular dashboard. Strictly ban queries against raw tables; force all UI endpoints to query daily, pre-computed summary tables.
Audit Apollo Sequence Templates: Review all active outbound sequences. Physically delete any template containing generic fallback placeholders ({{sender_name}}). Rewrite all copy to reflect a premium, human-authored, consultative tone.
Execute GTM A/B Testing Mathematics: Launch the "Agentic Automation" vs "Kubernetes TCO" test cohorts. Measure the Cost Per Meeting (CPM) over 14 days and brutally kill the losing sequence to maximize SDR efficiency.
Optimize Angular Initial Load: Ensure the Angular application utilizes strict route-level code splitting and server-side pre-rendering (SSG) for the login and marketing pages to guarantee sub-second Time-to-Interactive (TTI) for executive users.
Set Snowflake Resource Monitors: Configure strict credit quotas on the internal data warehouse. If the daily ELT batch job exceeds its expected compute threshold by 15%, automatically suspend the warehouse and page the data engineering on-call.
Standardize Multi-Cloud Ingestion: For clients requiring raw data ingestion, deploy native, localized S3/Azure Blob buckets to ingest their billing files natively within their respective clouds, mathematically avoiding cross-cloud egress taxes.
Calculate the Ppayback_months for SDRs: Track the fully loaded cost of the outbound sales team against the MRR they generate to ensure the enterprise is recovering its customer acquisition costs within a strict 3-month window.
Stop guessing where your Kubernetes budget is going. Schedule a demo here to explore Kubernetes cost monitoring with Cloud Atler.