
1. Executive Synthesis
By 2026, the enterprise data warehouse has evolved from a static reporting repository into a highly dynamic, multi-tenant execution engine powering real-time AI inferences, customer-facing applications, and massive parallel analytics. While this centralization of data (via platforms like Snowflake, BigQuery, and Databricks) solves severe data governance and data gravity challenges, it precipitates a catastrophic FinOps crisis: the inability to accurately execute internal chargebacks for shared data assets.
When fifty disparate engineering teams and business units query a single, centralized 10-Petabyte data lakehouse, hyperscaler billing mechanisms fail. The cloud invoice presents a massive, monolithic monthly charge for "Compute Credits" or "Data Scanned." Without rigorous telemetry and apportionment logic, FinOps teams default to arbitrary, socialized chargeback models—dividing the total data warehouse bill equally among business units, or apportioning it based on headcount. This socialized model destroys unit economics. It punishes highly optimized, efficient engineering teams by forcing them to subsidize the runaway, unoptimized Cartesian joins written by junior analysts in other departments.
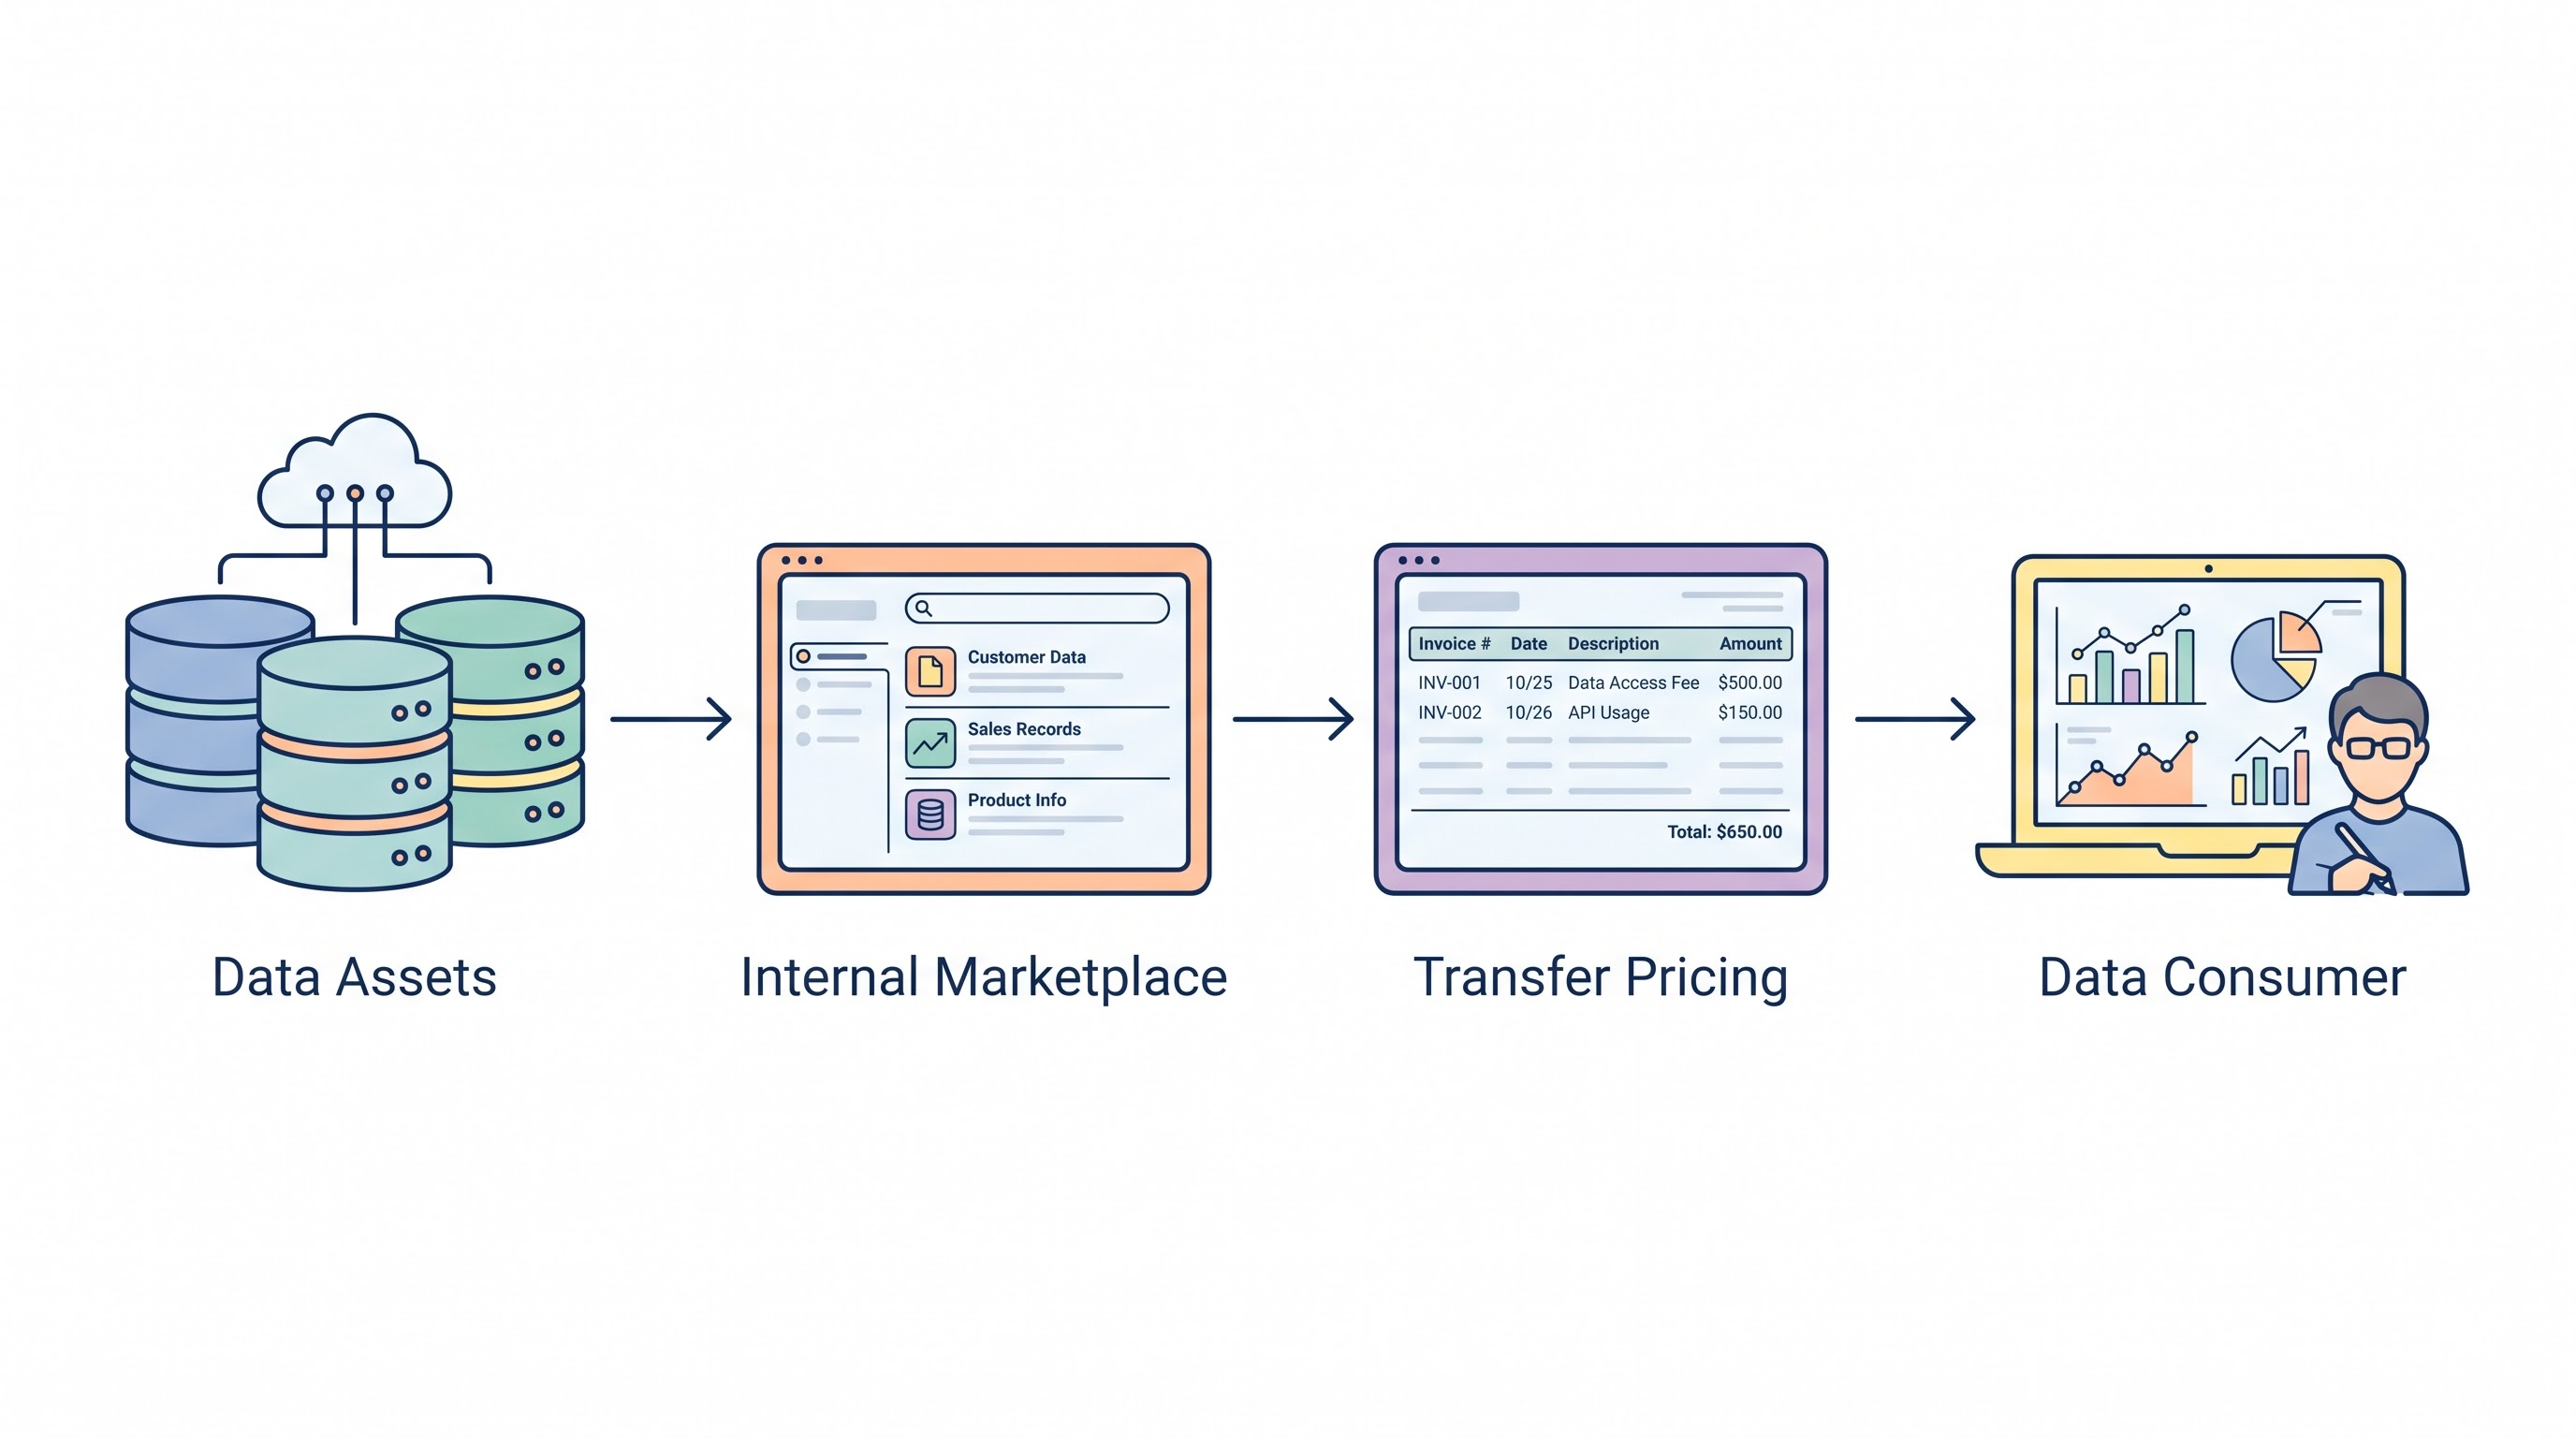
To defend enterprise gross margins and enforce developer accountability, organizations must transition their centralized data platforms into an internal FinOps Data Marketplace. This requires implementing the Shared Asset Transfer Pricing (SATP) Framework.
The SATP Framework treats the central data platform as an internal cloud provider. It demands that data engineering teams instrument the warehouse to tag, trace, and mathematically isolate every single query down to the invoking user, service account, and underlying BI dashboard. Furthermore, it introduces advanced mathematical models for apportioning the compute cost of shared transformations—e.g., if the data engineering team builds a foundational materialized view utilized by five different downstream SaaS products, the compute cost to build and refresh that view must be dynamically divided and billed to the P&Ls of those five products based on their proportional consumption. This playbook establishes the architectural instrumentation and financial algorithms required to enforce strict, granular data chargebacks at enterprise scale.
2. Market Gap & Search Intent Failure Analysis
Enterprise research regarding "Data Warehouse FinOps" or "Snowflake Cost Optimization" is plagued by superficial optimization tactics. Standard industry blogs focus exclusively on technical right-sizing: "suspend idle warehouses," "cluster your tables," or "avoid SELECT *." While these are valid engineering practices, they completely ignore the fundamental accounting problem of cost attribution in a multi-tenant environment.
The critical market gap is the total lack of Shared Asset Apportionment modeling. Analysts advise enterprises to "tag your queries," but they fail to explain the mathematics of downstream dependency billing. If Team A spends $500/day transforming raw JSON into a clean Core_Customer table, and Team B queries that table 1,000 times a day while Team C queries it 10 times a day, who pays the $500 transformation cost? Existing playbooks leave this as a manual finance exercise, which inevitably falls apart at enterprise scale. This playbook fills the gap by providing the strict transfer pricing equations required to automate dependency-aware data chargebacks directly within the modern data stack.
3. Core Strategic Framework
To execute granular data cost attribution, enterprises must adopt the Shared Asset Transfer Pricing (SATP) Framework. This framework replaces socialized IT taxation with usage-based, dynamically calculated internal transfer prices.
Implementation Protocol:
Query-Level Telemetry Injection: Enforce a strict architectural mandate requiring all BI tools, custom applications, and dbt models to inject a serialized JSON metadata string (containing cost_center, team, product_id) into the SQL query comments before execution.
Automated Cost Attribution (The FinOps DAG): Construct a FinOps-specific Directed Acyclic Graph (DAG) in dbt that parses the cloud provider's internal query history tables (e.g., Snowflake QUERY_HISTORY or BigQuery INFORMATION_SCHEMA.JOBS) daily, extracting the injected metadata and calculating the exact compute cost of each query.
Dependency Apportionment Engine: Utilize data lineage metadata to identify shared upstream transformation jobs. The engine calculates the total cost of the upstream job and mathematically distributes that cost to downstream consumers based on their proportional query volume.
Execution Decision Matrix:
If a query lacks proper FinOps metadata injection, it is automatically terminated by a warehouse resource monitor after 60 seconds, regardless of business priority.
If an unoptimized query scans
$>10\text{TB}$of data without a LIMIT or partition filter, trigger an automated Slack alert to the invoking user and charge their cost center at a 1.5x penalty rate.If a shared materialized view costs $1,000/month to refresh but has zero downstream queries over a 14-day trailing window, automated scripts must aggressively drop the view to eliminate stranded compute costs.
4. Financial Modeling Layer (MANDATORY)
Accurate internal chargebacks for data infrastructure require dynamic algorithms that calculate proportional consumption.
Core Equations
1. Direct Query Allocation Cost ($C_{query}$):
Calculates the exact financial cost of an individual query executed by a specific tenant.
$$C_{query} = \left( \frac{T_{execution\_sec}}{T_{warehouse\_uptime\_sec}} \right) \times C_{warehouse\_hourly} \times \omega_{complexity}$$Where:
$T_{execution\_sec}$= Time the specific query spent executing.$T_{warehouse\_uptime\_sec}$= Total time the virtual warehouse was active and billing.$C_{warehouse\_hourly}$= The hourly dollar cost of the warehouse size (e.g., X-Large).$\omega_{complexity}$= A weighting factor based on bytes scanned and slot/thread utilization.
2. Shared Asset Transfer Price ($P_{transfer}$):
Apportions the centralized data engineering cost of building and maintaining foundational data models to the downstream business units that consume them.
$$P_{transfer\_tenant\_A} = C_{upstream\_build} \times \left( \frac{Q_{tenant\_A}}{\sum_{i=1}^{n} Q_{total\_downstream}} \right)$$Where:
$C_{upstream\_build}$= Total monthly compute cost to load, clean, and transform the shared foundational table.$Q_{tenant\_A}$= Number of queries executed against the shared table by Tenant A.$Q_{total\_downstream}$= Total queries executed against the shared table by all tenants.
3. Data Storage Gravity Tax ($T_{gravity}$):
Calculates the penalty applied to teams that duplicate data into separate silos rather than querying the central, shared truth.
$$T_{gravity} = (V_{duplicate\_GB} \times P_{storage\_rate}) + \left( V_{duplicate\_GB} \times F_{governance\_risk} \right)$$Where:
$V_{duplicate\_GB}$= Volume of data extracted and stored in a secondary location.$F_{governance\_risk}$= Financial penalty applied per GB for creating out-of-sync data silos (e.g., $0.50/GB).
A) Sensitivity Analysis Table
This table models the financial impact on a specific business unit's budget when the enterprise shifts from a "Socialized Cost" model to the strict "SATP Apportionment" model, based on their query efficiency.
Variable (Team Query Efficiency) | Socialized Model Bill | SATP Model Bill (Usage Based) | EBITDA Margin Impact on BU |
Highly Optimized (Clustered, Filtered) | $25,000 / month | $4,000 / month | +$21,000 (Massive budget relief) |
Average (Standard BI Dashboarding) | $25,000 / month | $22,000 / month | +$3,000 (Slight improvement) |
Poor (Rogue Analysts, Cartesian Joins) | $25,000 / month | $85,000 / month | -$60,000 (Forces immediate optimization) |
Decision Threshold: The transition to SATP will cause immediate budget shocks for unoptimized teams. The CFO must mandate a 60-day "Shadow Billing" period where teams see their new SATP invoices but pay the old socialized rate, providing a window to refactor their SQL.
B) Break-Even Formula
The Materialized View Break-Even Point ($Q_{mv\_be}$) calculates the number of times a complex query must be run by end-users to financially justify the compute cost of the data engineering team pre-computing it into a Materialized View (MV).
$$Q_{mv\_be} = \frac{C_{mv\_build\_compute} + (V_{mv\_storage} \times P_{storage})}{C_{raw\_query} - C_{mv\_query}}$$Numerical Example: Querying raw logs costs $5.00 per run. Querying a pre-computed MV costs $0.10 per run. Building and updating the MV costs $500 per month, plus $20 in storage. Break-even is $520 / ($4.90) = 106 queries. If the business runs this report fewer than 106 times a month, building the MV destroys financial value. If they run it 1,000 times a month, the MV saves $4,380.
C) Probability-Weighted Risk Table
Quantifying the financial risks of multi-tenant data platforms.
Scenario | Probability | Financial Impact | Weighted Exposure |
Runaway Cartesian Join (Uncapped BI Tool) | 35.0% / month | $15,000 (Compute burn) | $5,250 per month |
Orphaned dbt Models (Daily refresh, zero usage) | 60.0% / month | $8,000 (Wasted compute) | $4,800 per month |
Cross-Region Data Egress (Misconfigured ingest) | 15.0% / month | $40,000 (Network bill) | $6,000 per month |
Failed Chargeback Dispute (CFO rejects invoice) | 10.0% / quarter | $120,000 (Unallocated IT spend) | $12,000 per quarter |
D) Cost-per-Unit Model
The central unit of measurement is the Cost Per Analytical Insight (CPAI):
$$CPAI = \frac{Total\_Data\_Warehouse\_Compute\_Cost}{Total\_Distinct\_Dashboard\_Loads + Total\_API\_Data\_Fetches}$$Threshold: If the $CPAI$ exceeds $2.00 per dashboard load, the data platform is structurally bloated. Architecture must enforce aggressive caching layers (e.g., Redis) or migrate static reporting workloads away from elastic compute warehouses.
5. Operational Architecture Integration
Query Tagging Injection via SQL Comments:
The foundational architecture for the FinOps Data Marketplace relies on metadata injection. Data platform administrators must configure all service accounts (e.g., the Looker service account, the Fivetran service account) to enforce connection-level session variables. Furthermore, developers using dbt must utilize the query-comment macro to automatically inject a JSON payload at the top of every compiled SQL string.
Example: /* {"app": "fraud_detection", "team": "risk_ops", "env": "prod"} */ SELECT...
When the query executes, this JSON string is permanently logged in the warehouse's QUERY_HISTORY view, making programmatic chargeback parsing perfectly reliable.
Warehouse Isolation and Multi-Cluster Routing:
In platforms like Snowflake, FinOps architecture requires isolating workloads by financial profile, not just technical function. A monolithic "X-Large" warehouse shared by ELT processes, Data Scientists, and basic BI users creates massive inefficiencies because the warehouse cannot spin down if even one user is active. Architecture must deploy Multi-Cluster Warehouses isolated by team and workload type (e.g., WH_ELT_PROD, WH_DATA_SCIENCE_ADHOC, WH_BI_REPORTING). This physically separates compute billing at the cloud-provider level, drastically simplifying the $C_{query}$ allocation math and allowing different auto-suspend timeouts based on the workload profile.
The Dependency Billing DAG (dbt Integration):
To execute the Shared Asset Transfer Price ($P_{transfer}$), FinOps data engineers must build a dedicated dbt project that analyzes the enterprise's primary data pipelines. This FinOps DAG queries the ACCESS_HISTORY tables to trace exactly which users queried which specific columns of foundational tables. It then calculates the proportional usage fractions and joins them against the compute cost of the upstream dbt models that generated those tables, producing a daily, immutable Ledger Table that the CFO uses for inter-departmental journal entries.
6. Failure Scenarios
Scenario 1: The BI Tool Auto-Refresh Hemorrhage
Breakdown: A marketing manager builds a highly complex Tableau dashboard that executes a 5-minute, $10 query. To ensure they always have the latest data, they set the dashboard to auto-refresh every 15 minutes, 24/7, leaving the browser tab open on a spare monitor.
Financial Exposure: 96 queries/day ×
$10 = $960/day. Over a month, a single unattended dashboard burns $28,800 in warehouse compute.Governance Prevention Layer: FinOps Resource Monitors & Caching. Architecture must enforce strict caching policies at the BI layer (e.g., requiring dashboards to serve from extracts or materialized views, not live warehouse connections). Furthermore, warehouse resource monitors must be configured to automatically sever any user session that exceeds a predefined daily compute quota ($500/day), instantly mitigating the hemorrhage.
Scenario 2: The Orphaned Data Pipeline
Breakdown: A data engineer builds a complex pipeline of 40 dbt models that run daily to power a specific executive report. Six months later, the executive leaves the company and the report is never looked at again. However, the data engineering team never deletes the pipeline. The warehouse continues to spend $400 a day refreshing data that has exactly zero downstream consumers.
Financial Exposure: $12,000 a month in stranded compute costs for orphaned data assets.
Governance Prevention Layer: Automated Lineage Pruning. The FinOps DAG must calculate the "Days Since Last Downstream Query" for every materialized asset. If an asset exceeds 30 days with zero consumption, the pipeline automatically strips the object's deployment schedule and downgrades it to a static, compressed storage archive, saving 100% of the ongoing compute cost.
Scenario 3: The Tragedy of the Data Commons
Breakdown: An enterprise utilizes a massive, single BigQuery billing project for the entire company. Because no individual team sees the cost of their specific queries, there is zero incentive to optimize SQL. Data scientists run SELECT * on petabyte tables repeatedly to test machine learning models. The cloud bill balloons by 400% in a single year.
Financial Exposure: Millions in unbudgeted cloud spend, leading to a freeze on new engineering hiring to offset the data warehouse deficit.
Governance Prevention Layer: The SATP Chargeback Mandate. By implementing the SATP framework and routing internal transfer pricing invoices directly to the P&L of the offending data science team, the CFO enforces immediate behavioral correction. When a team realizes a careless query costs their specific budget $500, they self-police and write highly optimized, partitioned queries.
7. Board-Level Translation Layer
EBITDA Delta Modeling: Shifting from socialized data platform costs to a FinOps Data Marketplace drives immediate EBITDA expansion through behavioral optimization. When engineering teams are financially accountable for their specific queries, historical enterprise data shows a 25-40% reduction in overall data warehouse compute consumption, recovering millions of dollars directly to the bottom line without sacrificing analytical capabilities.
Gross Margin Defense: For AI/ML and SaaS companies, data processing is a massive component of COGS. If the cost of shared data pipelines cannot be accurately attributed to specific product lines, the board cannot accurately calculate the gross margin of individual SaaS features. The SATP framework guarantees precise COGS attribution, enabling accurate, margin-defending product pricing.
Capital Allocation Signal: A high Cost Per Analytical Insight (
$CPAI$) signals to the board that the data architecture is fundamentally inefficient. It dictates that capital should be redirected away from buying more cloud compute and toward hiring specialized Data Architects to build optimized semantic layers and caching infrastructure.Risk-Adjusted ROI Formula:
$$ROI_{data\_finops} = \frac{\text{Eliminated Stranded Compute} + \text{Query Optimization Savings}}{\text{Data Eng Cost to Build FinOps DAG} + \text{Telemetry Compute Overhead}}$$
8. Data Visualization Suggestions
Shared Asset Dependency Tree: A directed graph visualization where the central node is a foundational data model, and the branches represent downstream consuming teams. The thickness of the branch represents the dollar value of the transfer price (
$P_{transfer}$) billed to that team.Socialized vs. Actual Usage Bar Chart: A side-by-side comparison for each business unit. The gray bar shows their arbitrary "socialized IT tax," and the green/red bar shows their mathematically calculated SATP bill, instantly highlighting which teams were subsidizing others.
Cost Per Query Scatter Plot: A scatter plot where X-axis is Query Execution Time and Y-axis is Total Bytes Scanned. Dots in the extreme upper-right quadrant represent highly toxic, unoptimized queries that require immediate FinOps intervention.
Orphaned Asset Heatmap: A visual representation of the data warehouse schemas. Tables are colored green (actively queried) fading to red (zero queries in 30+ days). The red clusters represent immediate targets for automated compute pruning.
FinOps Metadata Injection Architecture: A technical flow diagram showing a BI tool injecting JSON comments into a SQL string, the execution in Snowflake, and the subsequent dbt job parsing the QUERY_HISTORY to generate the financial ledger.
9. Why Analyst-Style Summaries Fail at Financial Precision
Generic analyst summaries regarding cloud data architecture frequently state: "Organizations must implement data mesh topologies and decentralize data ownership to improve agility." This advice is financially toxic if executed without rigorous FinOps controls.
Narrative advice fails because it ignores the compounding cost of duplicated compute and shared dependencies. If an enterprise blindly decentralizes data ownership (a "data mesh") without implementing the Shared Asset Transfer Pricing (SATP) framework, every decentralized team will build their own overlapping, unoptimized ETL pipelines to process the exact same raw data. The cloud bill will explode.
Equation-backed modeling, specifically the calculation of the $P_{transfer}$ and the Data Storage Gravity Tax ($T_{gravity}$), imposes strict financial physics on the data architecture. It mathematically proves that while decentralized ownership provides agility, it must be governed by a centralized financial ledger that ruthlessly taxes data duplication and perfectly allocates shared compute costs. You cannot manage a multi-million dollar data lake with decentralized philosophy; you manage it with uncompromising, programmatic accounting.
10. Strategic Conclusion
The modern cloud data warehouse is the central nervous system of the 2026 enterprise, but its financial mechanics are uniquely hostile to traditional IT budgeting. Because data storage is cheap while dynamic, elastic query compute is incredibly expensive, the financial risk has shifted entirely to execution efficiency. A single poorly constructed SQL join can cost more in 10 minutes than the monthly salary of the analyst who wrote it.
Treating the data platform as a socialized, centralized cost center is a catastrophic failure of governance. It actively encourages waste and obscures true product unit economics. To defend enterprise margins, organizations must architect a FinOps Data Marketplace.
By implementing the Shared Asset Transfer Pricing (SATP) Framework, FinOps leaders transform the data warehouse from a black box into a mathematically transparent marketplace. Through strict metadata injection, automated dependency tracking via dbt, and rigorous querying of native access logs, the enterprise can calculate the exact cost of every analytical insight and route that cost directly to the responsible P&L. This level of granular financial accountability immediately eliminates orphaned pipelines, forces the optimization of BI dashboards, and ensures that the massive compute power of hyperscaler data platforms is utilized strictly for profitable, high-ROI business intelligence.
11. Implementation Readiness Checklist
Mandate Metadata Query Tagging: Configure all service accounts (dbt, Fivetran, Looker, Tableau) to inject structured JSON payloads (containing user, team, cost_center) into every SQL query comment.
Deploy Warehouse Workload Isolation: Re-architect Snowflake or BigQuery environments to utilize dedicated, physically isolated compute clusters for distinct financial profiles (e.g., separating ELT jobs from Ad-hoc data science queries).
Build the FinOps dbt DAG: Develop a daily data pipeline that parses QUERY_HISTORY and ACCESS_HISTORY logs, extracting metadata tags and calculating the exact dollar cost of every query execution.
Implement the Transfer Pricing Ledger: Create an automated table that calculates the
$P_{transfer}$math, distributing upstream transformation costs proportionally to downstream consumers based on query volume.Establish Resource Quotas and Circuit Breakers: Configure warehouse monitors to immediately kill any query that exceeds a $50 cost threshold or scans unpartitioned petabyte tables without explicit FinOps override tags.
Automate Orphaned Asset Pruning: Deploy scripts that identify materialized views or dbt models with zero downstream queries over a 30-day window and automatically disable their scheduled compute refreshes.
Enforce BI Caching Policies: Audit all BI platforms to mandate the use of data extracts or semantic caching layers, explicitly banning high-frequency live connections to the elastic data warehouse for static reporting.
Calculate the Materialized View Break-Even (
$Q_{mv\_be}$): Require data engineering to mathematically prove that pre-computing an aggregate table will save more query compute dollars than it costs to continuously build.Initiate Shadow Billing: Run the SATP model in "shadow mode" for two months, distributing dummy invoices to department heads to prepare them for the budget shock of usage-based data billing.
Sunset Socialized Data IT Budgets: Formally transition the enterprise budget, permanently removing the centralized "Data Infrastructure" IT allocation and replacing it with direct, dynamic department-level chargebacks.
Stop guessing where your Kubernetes budget is going. Schedule a demo here to explore Kubernetes cost monitoring with Cloud Atler.