
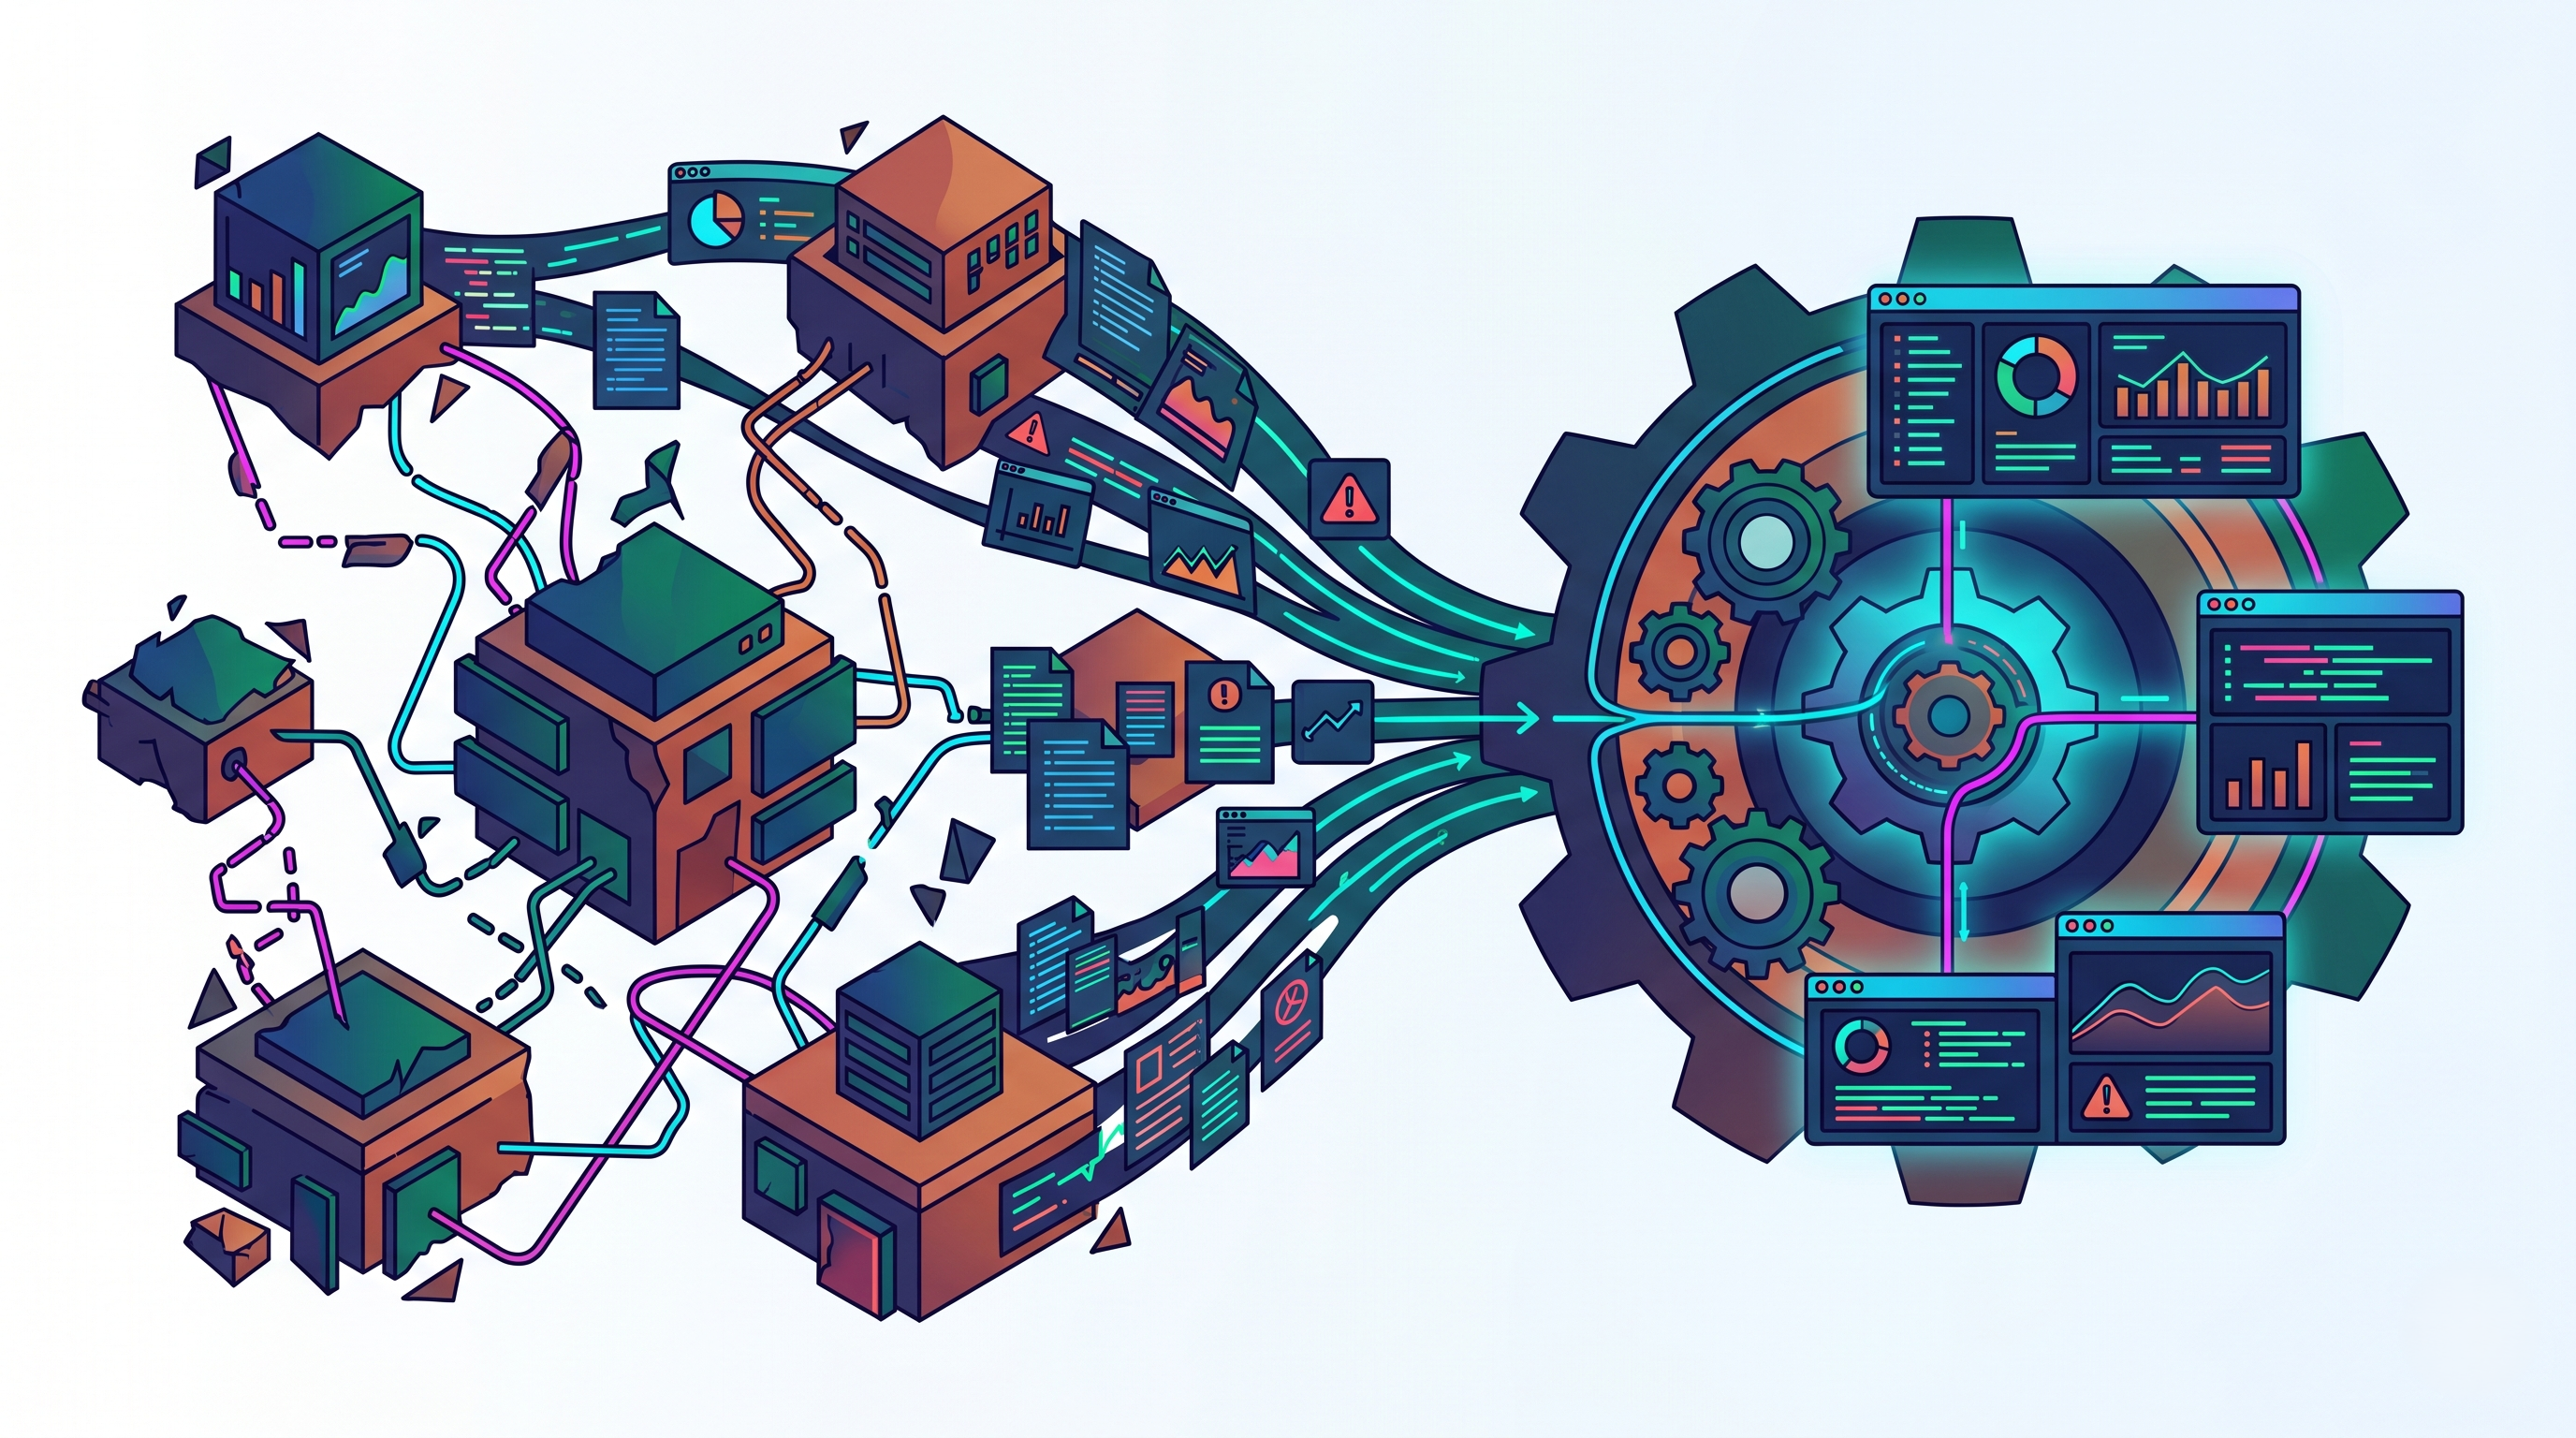
Cloud-native infrastructure transformed how modern applications are built and operated. Kubernetes, microservices, serverless architectures, APIs, and distributed cloud platforms now allow organizations to scale applications faster, deploy continuously, and support highly dynamic workloads across global environments.
But while cloud-native systems improved scalability and agility, they also introduced a new operational reality: modern infrastructure is far more difficult to observe clearly than traditional systems ever were.
In older environments, applications often ran on relatively static infrastructure with predictable traffic patterns and centralized operational visibility. In cloud-native environments, workloads scale automatically, containers appear and disappear within seconds, services communicate across distributed networks, and telemetry volumes grow continuously.
The result is that many organizations now have more operational data than ever before yet less operational clarity.
This is why observability has become one of the most important operational disciplines in cloud-native infrastructure management. However, implementing effective observability in distributed systems comes with major challenges that many organizations underestimate initially.
In this blog, we will explore the biggest observability challenges in cloud-native infrastructure environments, why these issues are becoming more severe in 2026, and why unified operational visibility is increasingly essential for modern infrastructure operations.
Distributed Systems Create Fragmented Visibility
One of the biggest challenges in cloud-native environments is that applications are no longer centralized. Modern workloads are distributed across microservices, Kubernetes clusters, APIs, databases, serverless functions, and third-party services operating simultaneously across different infrastructure layers.
A single user request may pass through dozens of services before completing successfully. Each service generates its own logs, metrics, traces, and operational events independently.
The challenge is that operational visibility becomes fragmented across these layers. Engineers may see symptoms in one service while the root cause exists somewhere entirely different within the infrastructure.
Without strong correlation across telemetry sources, troubleshooting becomes significantly more difficult and time-consuming.
The more distributed the architecture becomes, the harder it becomes to maintain a unified operational understanding.
Kubernetes Environments Change Continuously
Kubernetes introduced enormous flexibility into cloud-native operations, but it also created major observability complexity.
Containers scale dynamically, pods restart automatically, workloads move between nodes, and infrastructure topology changes continuously based on operational demand. Traditional monitoring approaches designed for static infrastructure struggle to keep up with this level of dynamism.
For example:
A container generating errors may no longer exist minutes later
Autoscaling may alter cluster behavior continuously
Resource allocation patterns shift dynamically
Namespace activity evolves constantly
This makes historical correlation and operational tracing far more difficult than in traditional environments.
Kubernetes environments require observability systems capable of tracking highly ephemeral infrastructure behavior in real time.
Telemetry Volumes Are Growing Faster Than Teams Can Manage
Modern cloud-native environments generate enormous amounts of telemetry data.
Organizations collect:
Infrastructure metrics
Application logs
Distributed traces
Kubernetes events
Security telemetry
API activity
AI workload signals
As environments scale, telemetry growth accelerates rapidly.
The challenge is that more data does not automatically create better visibility. In many cases, teams become overwhelmed by operational noise, duplicate alerts, excessive logging, and fragmented monitoring systems.
Organizations frequently spend heavily on observability tooling while still struggling to identify meaningful operational insights quickly during incidents.
The real challenge today is not collecting telemetry. It is turning telemetry into actionable operational understanding.
Context Switching Slows Incident Response
Cloud-native observability often involves multiple disconnected platforms operating simultaneously.
Teams commonly use separate tools for:
Infrastructure monitoring
Kubernetes observability
Distributed tracing
Log aggregation
Cloud provider telemetry
Security monitoring
Cost visibility
When incidents occur, engineers must switch constantly between dashboards, APIs, and telemetry systems to reconstruct what happened operationally.
This context switching creates cognitive overload and slows incident response significantly.
The issue becomes even worse during large-scale outages where signals flood multiple systems simultaneously without clear operational prioritization.
Fragmented observability environments often increase operational complexity instead of reducing it.
Alert Fatigue Is Becoming a Serious Operational Problem
One of the most common observability failures in cloud-native infrastructure is alert overload.
Modern environments generate enormous volumes of notifications from monitoring systems, Kubernetes events, infrastructure telemetry, security tools, and observability platforms continuously.
The problem is that many alerts lack sufficient context individually. Teams receive isolated operational signals without understanding how those events relate to broader infrastructure behavior.
This creates alert fatigue, where engineers become desensitized to notifications because operational noise overwhelms meaningful prioritization.
As a result, genuinely important issues may be overlooked or identified too late during incidents.
Observability without prioritization creates operational distraction rather than operational clarity.
Distributed Tracing Is Powerful but Difficult to Implement Properly
Distributed tracing helps organizations follow requests across microservices and infrastructure layers, making it one of the most valuable observability capabilities in cloud-native environments.
However, implementing tracing effectively is far from simple.
Challenges include:
Instrumentation consistency
Trace sampling decisions
Cross-service correlation
Telemetry overhead
Storage scalability
Visualization complexity
As architectures scale, maintaining high-quality tracing coverage becomes an increasingly difficult operation.
Incomplete tracing data often creates false visibility confidence because teams assume they understand system behavior while important operational gaps still exist.
Tracing is essential for distributed systems, but maintaining meaningful tracing visibility at scale requires significant operational maturity.
Multi-Cloud and Hybrid Infrastructure Increase Observability Fragmentation
Organizations increasingly operate across AWS, Azure, Google Cloud, Kubernetes environments, edge systems, and private infrastructure simultaneously.
Each environment generates different telemetry formats, operational models, APIs, and monitoring standards.
This creates fragmented observability because visibility becomes siloed across environments rather than unified operationally.
A performance issue affecting customer experience may involve multiple infrastructure providers and service layers simultaneously, but disconnected telemetry systems make those relationships difficult to identify quickly.
The more distributed the infrastructure becomes, the more important unified observability becomes operationally.
AI Workloads Introduce New Visibility Challenges
AI infrastructure is adding another layer of observability complexity in modern cloud-native environments.
Organizations now manage:
GPU clusters
AI inference pipelines
Model-serving infrastructure
Vector databases
Distributed training systems
These workloads generate specialized telemetry patterns that traditional infrastructure monitoring approaches were not designed to handle.
GPU utilization, model latency, resource fragmentation, inference throughput, and AI workload behavior all require more advanced operational visibility capabilities.
As AI adoption accelerates, observability complexity increases significantly across infrastructure ecosystems.
Observability Costs Are Rising Rapidly
One of the hidden challenges in cloud-native observability is cost.
Logs, metrics, traces, and telemetry pipelines consume substantial infrastructure resources. As environments scale, observability platforms themselves become major operational cost centers.
Common cost drivers include:
High-cardinality metrics
Excessive debug logging
Long retention periods
Duplicate telemetry pipelines
Unoptimized trace sampling
Organizations often respond to observability complexity by collecting even more telemetry, which increases infrastructure overhead further.
The challenge is balancing operational visibility with sustainable infrastructure efficiency.
More observability data is not always better observability.
Security Observability Is Becoming More Complex Too
Cloud-native observability now extends beyond performance and infrastructure monitoring into security visibility as well.
Organizations must monitor:
Identity behavior
Kubernetes activity
API exposure
Configuration drift
Threat detection signals
Compliance posture
Security telemetry adds another layer of operational complexity because risks often span multiple environments simultaneously.
Without unified operational visibility, security teams struggle to prioritize threats effectively or understand infrastructure context during incidents.
Observability is increasingly becoming both an operational and security requirement simultaneously.
Visibility Without Context Is Not Enough
One of the biggest misconceptions in observability is assuming that more dashboards automatically improve operational understanding.
In reality, disconnected telemetry often creates operational noise rather than clarity. Teams may have access to enormous amounts of infrastructure data while still lacking a meaningful understanding of how systems behave together operationally.
Modern observability requires contextual correlation across:
Infrastructure behavior
Workload activity
Performance trends
Resource utilization
Security posture
Operational dependencies
The goal is not simply to collect more operational signals. It is understanding which signals actually matter operationally.
Contextual visibility is becoming more important than raw telemetry volume itself.
Strengthening Cloud-Native Visibility with Atler Pilot
One of the biggest challenges in cloud-native observability is maintaining operational clarity across increasingly fragmented and dynamic infrastructure environments.
This is where Atler Pilot helps organizations gain deeper operational visibility across cloud-native systems by connecting infrastructure behavior, workload activity, utilization patterns, and operational signals into a more unified view. Instead of relying solely on disconnected dashboards and fragmented telemetry layers, teams gain more contextual understanding of how infrastructure behaves operationally across environments.
This helps organizations identify inefficiencies, investigate incidents more effectively, improve operational awareness, and reduce the complexity of managing distributed cloud-native systems at scale.
As Kubernetes, AI infrastructure, and multi-cloud environments continue growing in complexity, unified operational visibility becomes increasingly important for maintaining both reliability and operational efficiency.
Sign up for Atler Pilot and explore how deeper operational visibility can help your team improve observability across modern cloud-native environments with greater clarity and control.
Conclusion
Cloud-native infrastructure introduced incredible scalability and flexibility, but it also transformed observability into one of the most difficult operational challenges modern organizations face.
Distributed systems, Kubernetes environments, telemetry growth, AI infrastructure, multi-cloud architectures, and fragmented tooling ecosystems all contribute to increasingly complex operational visibility problems.
Organizations that succeed in modern cloud operations will not simply collect more telemetry. They will focus on building contextual operational understanding across increasingly dynamic infrastructures.
Because in cloud-native environments, the challenge is no longer simply generating operational data.
It is understanding what that data actually means before operational complexity overwhelms visibility itself.
All in One Place
Atler Pilot decodes your cloud spend story by bringing monitoring, automation, and intelligent insights together for faster and better cloud operations.