
What FinOps Actually Means in Practice
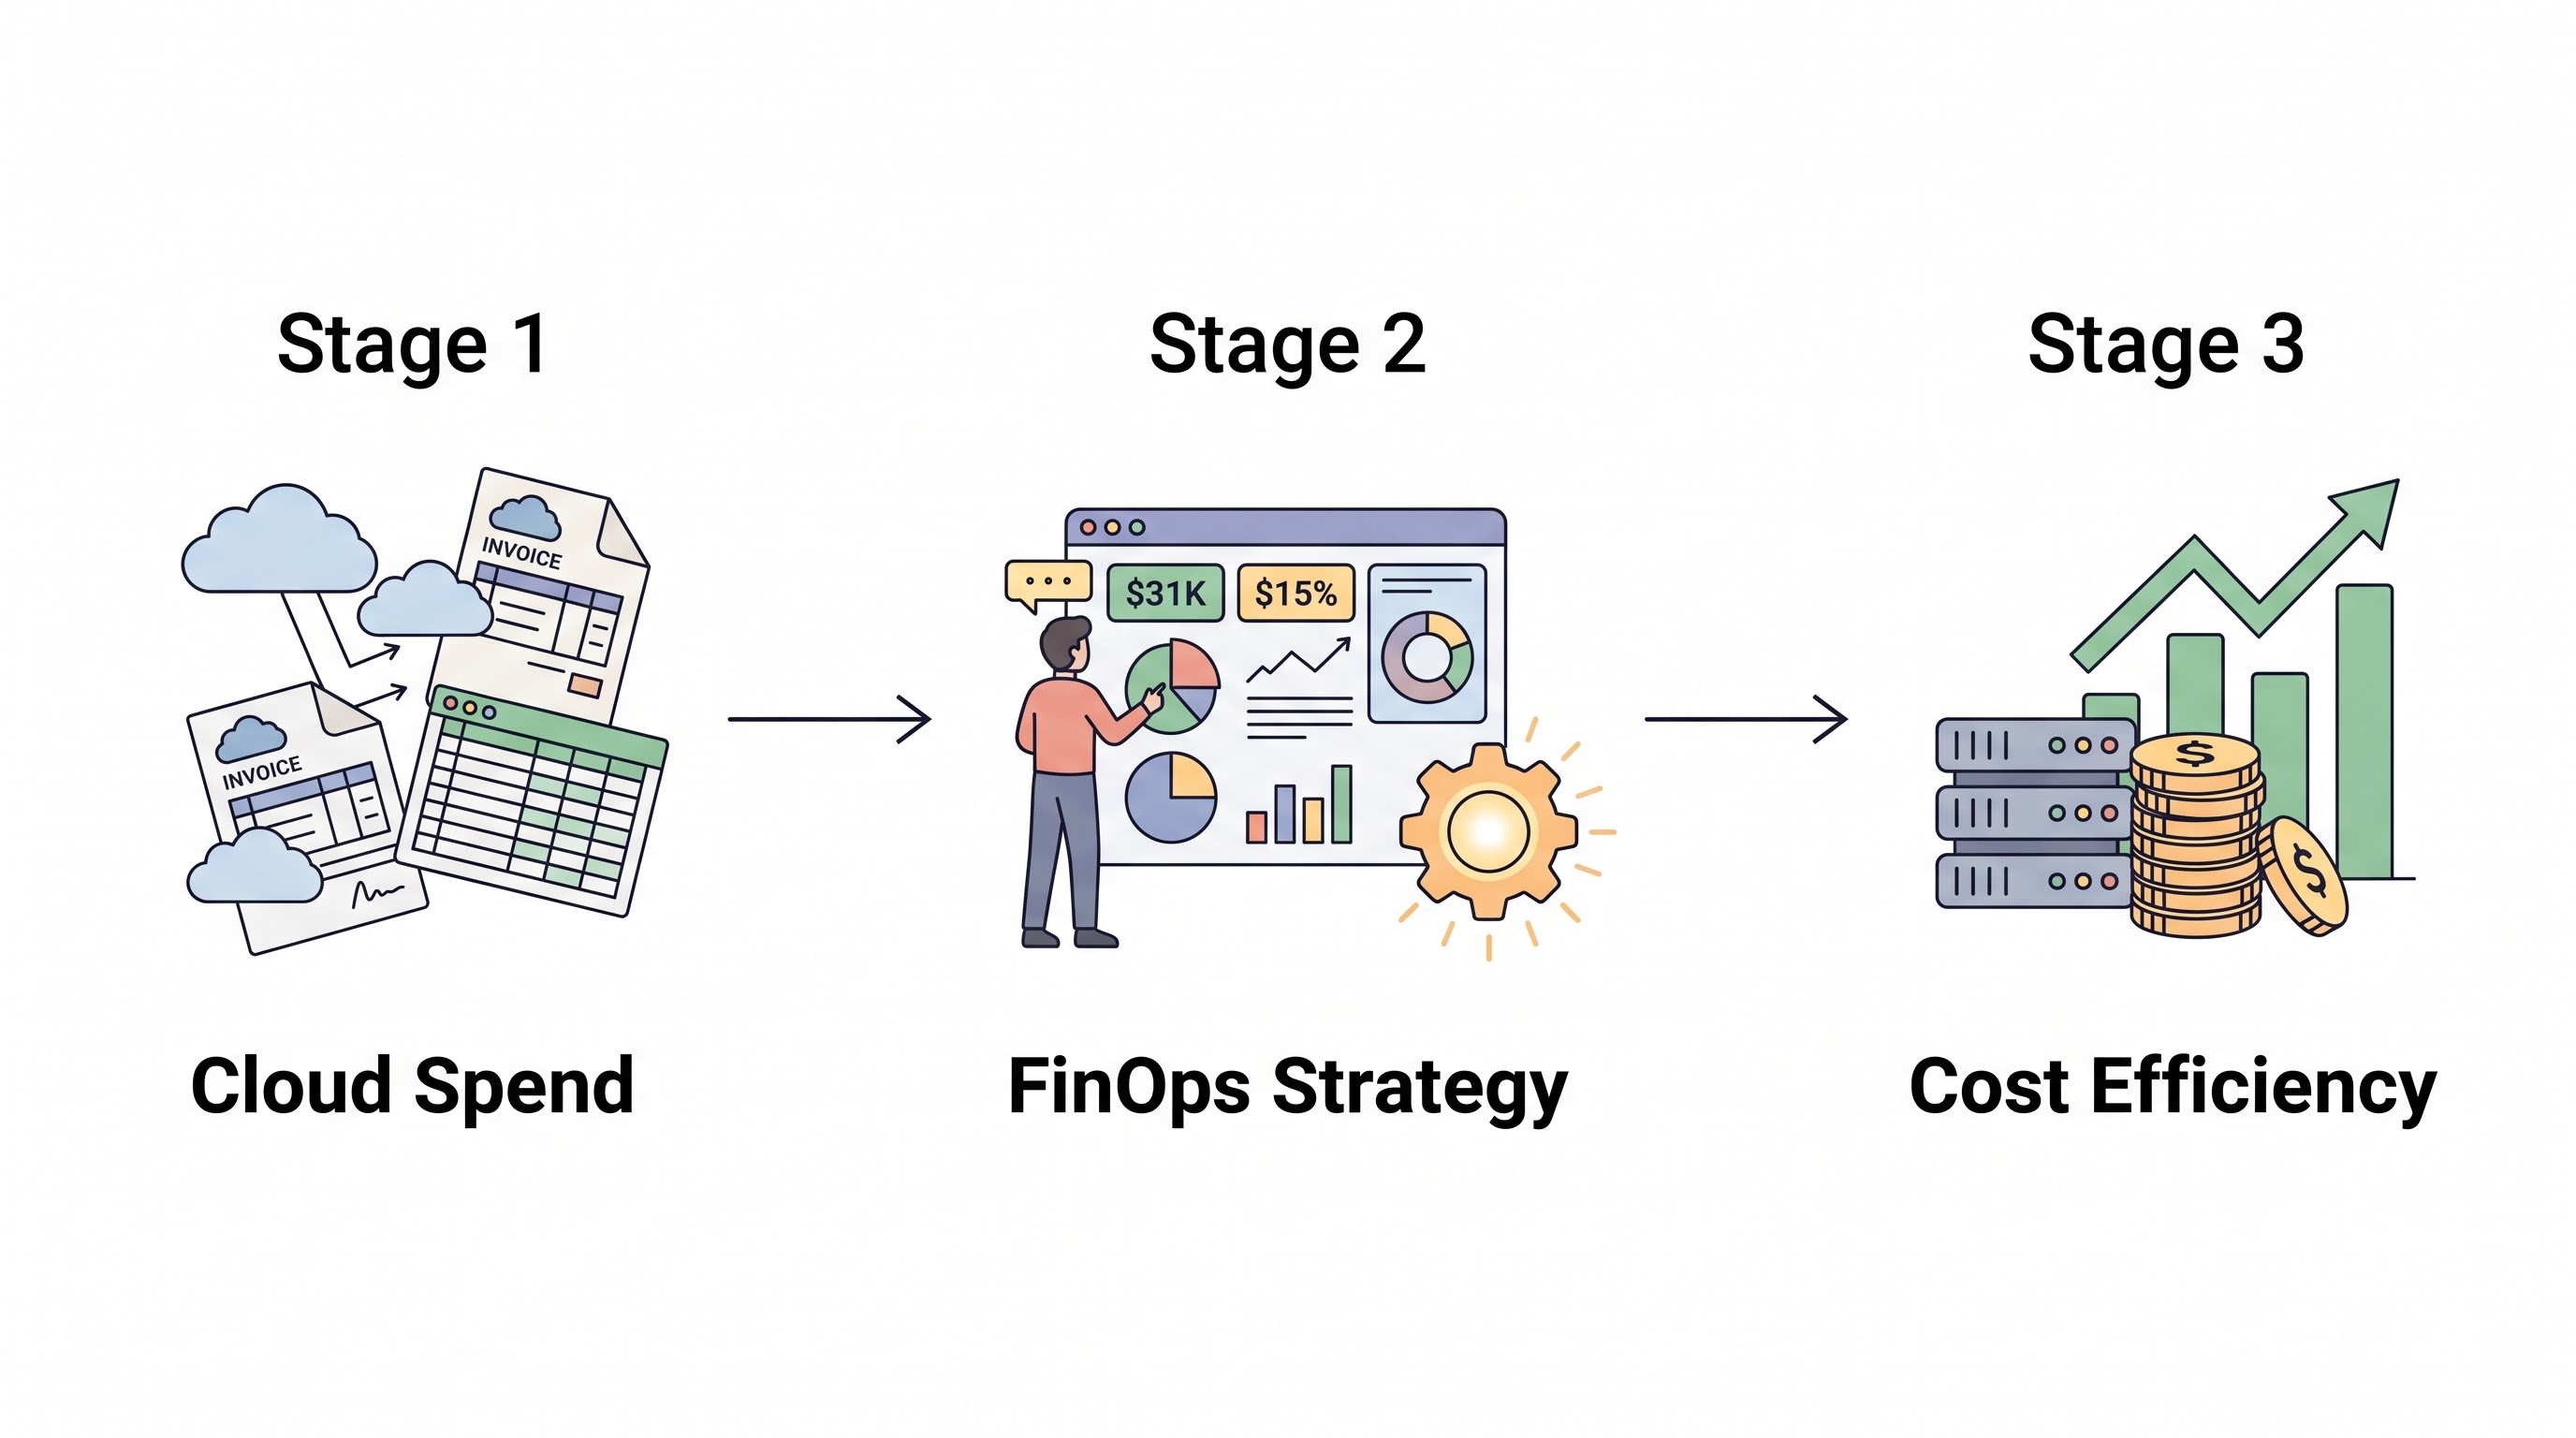
FinOps is the operating model that brings financial accountability to cloud spending. That single sentence carries more weight than most teams realize when they first encounter the term. It is not a dashboard product. It is not a weekly cost review meeting scribbled on someone's calendar. It is a cultural and operational shift that puts engineering, finance, and business leadership around the same table — staring at identical numbers — asking whether the organization is extracting genuine value from every dollar it sends to its cloud providers.
The FinOps Foundation formalized the discipline in 2019, but the practice existed long before any branding appeared. Engineers who right-sized EC2 instances after noticing a spike in monthly invoices were practicing FinOps without a label. The difference today is that organizations have grown complex enough — spanning AWS, Azure, GCP, and sometimes Oracle Cloud Infrastructure — that informal cost watching no longer scales. Structure is required. Process is required. A framework that ties cloud financial management to measurable business outcomes is required.
What separates FinOps from traditional IT budgeting is speed of feedback. Cloud bills change hourly. A developer spins up a GPU cluster for a machine learning experiment on Monday, forgets about it Wednesday, and finance discovers a $14,000 charge the following month. Traditional procurement cycles — quarterly reviews, annual budgets — cannot keep pace with infrastructure that provisions in seconds. FinOps closes that gap by creating real-time cloud cost monitoring loops where spending decisions happen at the speed of deployment rather than the speed of accounting.
At its core, the discipline asks three questions of every workload: what does it cost, who owns that cost, and is the spend justified by the business value it produces? If your organization can answer all three for every significant line item on the bill, you have mature FinOps. If you cannot, this guide walks you through getting there — from first principles to production-grade practice.
The Three Phases: Inform, Optimize, Operate
The FinOps framework breaks cloud financial management into three iterative phases. They are not sequential milestones you complete once and set aside. They form a continuous cycle, each revolution tightening the loop as your organizational capability matures.
Phase 1 — Inform
Visibility always comes first. You cannot optimize what you cannot measure, and most organizations are startled by how poor their visibility actually is when they begin a serious assessment. The Inform phase concentrates on building a clear, accurate, and accessible picture of cloud spend. This means pulling billing data from every cloud provider — AWS Cost Explorer and CUR reports, Azure Cost Management exports, GCP billing exports to BigQuery — and normalizing it into a single unified view.
Normalization is harder than it sounds. AWS charges for data transfer out at different rates depending on region and volume tier. Azure charges for inter-region VNet peering using a different model. GCP bundles certain network egress into compute pricing. A unified cost view needs to reconcile these differences, apply consistent tagging and labeling standards, and allocate shared costs like enterprise support fees or committed use discounts across the teams that benefit from them.
Key activities during the Inform phase include:
Establishing a cloud cost allocation taxonomy — segmented by team, by product line, and by environment (development, staging, production)
Implementing mandatory tagging policies with enforcement via automated tagging tools
Building dashboards that surface cost trends over time, not just point-in-time snapshots
Creating anomaly alerting that catches unexpected spend within hours rather than weeks
Publishing cost data broadly so engineers can self-serve answers without filing support tickets
The common trap during this phase is spending months perfecting dashboards before anyone acts on the data. Eighty percent accuracy is sufficient to start. Tagging coverage can improve from 60% to 95% incrementally over quarters, but waiting for perfection means months of unoptimized spend bleeding through unchecked.
Phase 2 — Optimize
With visibility established, the Optimize phase targets waste. Every cloud environment contains it. Industry benchmarks from the FinOps Foundation suggest organizations waste between 25% and 35% of their cloud spend. The accessible savings typically come from predictable sources:
Idle resources — load balancers pointing at terminated backends, EBS volumes detached from any instance, Cloud SQL databases with zero connections for thirty consecutive days
Oversized instances — an m5.4xlarge running a service peaking at 12% CPU utilization. Rightsizing it to an m5.xlarge cuts the cost by 75% without degrading performance
Missing commitments — on-demand pricing is the most expensive consumption model. Reserved Instances and Savings Plans reduce compute costs by 30% to 60% depending on term length and payment structure
Architecture inefficiencies — a NAT Gateway processing 8 TB of traffic monthly when a VPC endpoint would cost a fraction of that amount. Network cost reduction remains consistently underappreciated
Optimization is not a one-time sprint. Fresh waste accumulates constantly as teams ship features, provision test environments, and experiment with new services. The objective is establishing recurring optimization cycles — weekly for quick wins like idle resource cleanup, monthly for commitment planning, quarterly for architecture-level reviews.
Phase 3 — Operate
The Operate phase is where FinOps becomes self-sustaining. Policies are codified into infrastructure-as-code guardrails. Budget alerts fire before thresholds are breached rather than after. Engineering teams own their cost metrics with the same rigor they apply to latency SLOs and uptime targets.
Operating FinOps at scale demands automation. Manual spreadsheet analysis breaks down past twenty cloud accounts. Platforms like CloudAtler's Financial Command Center consolidate multi-cloud spend, surface AI-driven optimization recommendations, and track whether teams actually act on those recommendations. The Operate phase is also where teams connect cloud unit economics — cost per transaction, cost per customer, cost per API call — to business performance. This is the bridge between engineering efficiency and executive strategy.
FinOps Maturity Model Explained
The FinOps Foundation defines three maturity stages: Crawl, Walk, and Run. They map to organizational capability rather than calendar time. Some teams reach Run-stage commitment management while still Crawling on cost allocation. That unevenness is normal and expected. Maturity is rarely uniform across all capabilities simultaneously.
Stage | Characteristics | Typical Timeline |
|---|---|---|
Crawl | Basic reporting, ad-hoc optimization, limited tagging coverage, reactive budget management | Months 0–6 |
Walk | Consistent tagging above 80%, showback or chargeback models active, regular rightsizing cadence, RI/SP coverage above 50% | Months 6–18 |
Run | Automated governance via policy-as-code, unit economics tied to business KPIs, engineering ownership of cost, predictive budget forecasting | 18+ months |
A common misconception is that reaching higher maturity stages requires expensive enterprise tooling. It does not — at least not initially. Crawl stage runs effectively on native cloud billing consoles plus a shared spreadsheet. Walk stage benefits from a dedicated FinOps automation platform, but disciplined teams can reach it with open-source tools. Run stage nearly always requires a commercial platform because the data volume and cross-cloud normalization demands exceed what manual processes or lightweight scripts can handle sustainably.
Assess your maturity honestly across each capability area. Overestimating where you stand leads to skipping foundational work that becomes costly to backfill later. If your tagging compliance sits below 70%, you are still in Crawl regardless of how polished your dashboards appear on the surface.
Who Sits on a FinOps Team
FinOps is cross-functional by design and by necessity. A team composed entirely of finance analysts produces sophisticated reports that gather dust because no engineer acts on them. A team staffed exclusively with engineers optimizes aggressively but loses sight of business context and executive communication. The right FinOps team structure bridges both disciplines and adds business partnership.
A typical FinOps team at a mid-size organization — roughly 500 to 5000 cloud-connected employees — includes these roles:
FinOps Lead or Director — owns the program, reports to VP of Engineering or CTO (sometimes CFO depending on organizational structure). Must be fluent in cloud architecture patterns and financial modeling vocabulary
Cloud Cost Analysts (two to three people) — pull billing data, build and maintain reports, identify anomalies and trends, track optimization impact over time. Comfortable with SQL, billing APIs, and spreadsheet modeling
Cloud Engineers (one to two people) — execute rightsizing changes, handle commitment purchases, implement architecture optimizations. Often embedded within platform or infrastructure engineering teams
Business Liaison (one person) — translates cost data into language executives understand. Connects cost trends to product roadmap decisions and revenue forecasts
Smaller organizations — those spending under $500K per month on cloud — often start with a single FinOps practitioner who wears every hat simultaneously. That approach is viable through Crawl and early Walk stages. Past $1M in monthly spend, you need dedicated roles or the workload outpaces any individual no matter how capable they are.
One philosophical point deserves emphasis: the FinOps team does not own cloud costs. Engineering teams own their costs. The FinOps team provides the visibility tools, optimization processes, and coaching to make that ownership effective. This distinction matters enormously. When the FinOps team becomes cost police, engineers route around them through shadow accounts and untagged resources. When the FinOps team positions itself as the cost enablement function, engineers actively seek collaboration.
Building Your FinOps Tooling Stack
Tooling falls into three categories: native cloud tools, open-source instruments, and commercial platforms. Most organizations that practice FinOps seriously end up with a blend of all three.
Native Cloud Tools
Every major provider ships cost management features at no additional charge. AWS provides Cost Explorer, Budgets, and the Cost and Usage Report (CUR). Azure offers Cost Management plus Billing with Advisor recommendations. GCP has the Cloud Billing console with BigQuery export for detailed analysis. These tools are free to use and provide a solid starting foundation, but each one only has visibility into its own provider. Multi-cloud environments — an increasingly common reality — leave blind spots when relying exclusively on native tools.
Open-Source Options
Tools like OpenCost (for Kubernetes cost allocation) and Infracost (for Terraform cost estimation before deployment) fill specific and valuable gaps. They are well-suited for teams with the engineering capacity to deploy, configure, and maintain them over time. They are not comprehensive FinOps platforms and should not be expected to serve as such.
Commercial FinOps Platforms
Platforms like CloudAtler's Financial Operations Platform provide the full stack: multi-cloud billing normalization, AI-driven optimization recommendations, commitment intelligence, automated tagging enforcement, budget forecasting, and executive reporting dashboards. The value proposition comes down to time — a commercial platform delivers in weeks what would take months to build and maintain internally. The trade-off is a subscription cost, which typically pays for itself within the first optimization cycle through identified savings.
When evaluating a FinOps platform for your organization, prioritize these capabilities:
Multi-cloud support covering AWS, Azure, and GCP at minimum — Oracle if your environment includes OCI
Granular cost allocation with chargeback and showback model support
Anomaly detection that fires meaningful alerts within hours, not days or weeks
Commitment tracking and purchase recommendations with utilization monitoring
Integration with your existing workflow tools — Slack, Jira, PagerDuty, ServiceNow
Provider-Specific Considerations
Each cloud provider prices services differently, and FinOps practices must account for these structural differences to be effective.
AWS FinOps Nuances
AWS billing data is granular but densely complex. The CUR report can contain millions of line items for a large organization. Reserved Instances and Savings Plans overlap in ways that confuse even experienced practitioners — Compute Savings Plans offer flexibility across instance families, while EC2 Instance Savings Plans deliver deeper discounts but lock you to a specific family. Navigating these options requires understanding your workload stability profile. Stable, predictable workloads benefit from 3-year All Upfront RIs. Variable workloads benefit from Compute Savings Plans with no upfront payment.
Watch for these AWS-specific waste patterns: NAT Gateway data processing charges (easily $3,000 to $10,000 monthly for architectures with chatty east-west traffic), CloudWatch log ingestion fees (particularly from verbose Lambda functions), and S3 lifecycle policies that never move cold objects to Glacier despite clear access pattern evidence.
Azure FinOps Nuances
Azure Enterprise Agreements add structural complexity. Monetary commitments, overage pricing tiers, and Azure Hybrid Benefit (for organizations holding Windows Server and SQL Server licenses) create optimization levers that do not exist on competing platforms. Azure Reservations cover VMs, SQL databases, Cosmos DB, App Service plans, and additional services. Azure Advisor provides built-in rightsizing suggestions, but recommendations tend toward conservatism — often suggesting a single size reduction when utilization data supports two.
GCP FinOps Nuances
GCP applies sustained use discounts automatically, which decreases the urgency of commitment purchases for certain workloads. Committed Use Discounts (CUDs) offer deeper savings but require 1-year or 3-year commitments. BigQuery consistently surprises teams with unexpected bills — on-demand pricing generates alarming charges when analysts run exploratory queries against large datasets. Switching to flat-rate pricing or implementing slot reservations becomes necessary for any team spending more than $5,000 monthly on BigQuery. See the GCP cost management guide for detailed strategies.
Metrics That Prove FinOps Is Working
Tracking the wrong metrics is worse than tracking nothing because it creates a false sense of progress. Here are the indicators that genuinely signal FinOps maturity and impact:
Metric | What It Measures | Healthy Target |
|---|---|---|
Commitment Coverage | Percentage of eligible compute covered by RIs, Savings Plans, or CUDs | 70–85% |
Effective Savings Rate | Actual discount achieved relative to full on-demand pricing | 25–40% |
Tagging Compliance | Percentage of cloud resources carrying all required allocation tags | Greater than 90% |
Waste Ratio | Idle and unattached resource spend as a percentage of total cloud spend | Below 5% |
Forecast Accuracy | Variance between predicted and actual monthly spend | Below 10% |
Unit Cost Trend | Cost per transaction, per customer, or per business operation over time | Flat or declining |
Optimization Velocity | Average days from a savings recommendation being surfaced to its implementation | Under 14 days |
The single most important metric on this list is unit cost. Total cloud spend increasing is not inherently negative — if revenue grows faster, your cloud unit economics are improving. A company spending $2M monthly with $50M in monthly revenue demonstrates better cloud economics than a company spending $500K with $2M revenue, even though the absolute spend is four times larger. Unit cost connects infrastructure expense to business output in a way that total spend alone never can.
Track metrics monthly at minimum. Publish results where leadership and engineering teams can both access them without gatekeepers. CloudAtler's finance and cloud intelligence module automates metric tracking and trend visualization, eliminating the manual effort of assembling monthly reports from disparate data sources.
Mistakes That Derail Adoption
Having observed dozens of organizations attempt FinOps adoption, certain failure patterns appear with discouraging consistency:
Starting with tooling rather than culture. Purchasing a platform before establishing executive sponsorship and engineering buy-in leads to expensive shelfware. The tool becomes another dashboard nobody opens past the first week. Begin with a kickoff meeting where the CTO and CFO jointly endorse the program. That political signal carries more weight than any software purchase order.
Framing FinOps as a cost-cutting initiative. FinOps is not about spending less money. It is about spending money more effectively. An organization that reduces cloud costs by 30% but breaks three production services and delays two product launches has not practiced FinOps — it has practiced reckless austerity. Frame the discipline around value delivery, not expense reduction.
Ignoring shared cost categories. Enterprise support charges, marketplace subscriptions, network backbone costs, and cross-account data transfer fees often go unallocated. They pile up in a bucket labeled "overhead" and nobody takes responsibility. Develop allocation rules for shared costs — even imperfect rules — so every dollar on the bill maps to a responsible owner.
Over-optimizing development environments. Development environments should be right-sized and powered down outside business hours — absolutely. But they should not receive the same scrutiny as production infrastructure. Developer productivity carries its own dollar value, and slowing engineers down to save $200 monthly on a staging cluster is a net loss for the business. Concentrate optimization energy on production workloads where spending is concentrated.
Purchasing commitments without an infrastructure roadmap. Reserved Instances bought without analyzing workload stability become stranded cost obligations. If a team plans to migrate from EC2 to Fargate within six months, purchasing a 3-year RI for those instances destroys value rather than creating it. Commitment purchases must align with the organization's infrastructure direction.
Getting Started This Quarter
If your organization has zero formal FinOps practice today, here is a pragmatic 90-day roadmap:
Weeks 1–2: Lay the Foundation
Secure executive sponsorship from CTO or VP Engineering
Identify a FinOps champion within the organization — this person does not need a new title, just a clear mandate
Enable billing exports: AWS CUR reports to S3, Azure cost exports to a storage account, GCP billing exports to BigQuery
Audit current tagging coverage across all cloud accounts and document the gap
Weeks 3–4: Capture Quick Wins
Run idle resource scans across all connected clouds — terminate or delete everything unattached and unused for 30 or more days
Identify the top 10 most expensive resources in each cloud account — these are your highest-value optimization targets
Review AWS Trusted Advisor, Azure Advisor, and GCP Recommender for rightsizing suggestions and act on the obvious ones
Implement a tagging policy covering at minimum: team, environment, cost-center, and application name
Weeks 5–8: Build Structure
Build or deploy a cost dashboard showing spend by team and by environment, refreshed daily
Establish a weekly cost review meeting — 30 minutes maximum — with engineering leads from the highest-spending teams
Evaluate and deploy a multi-cloud FinOps platform for centralized visibility across providers
Begin commitment analysis — identify workloads with stable, predictable resource consumption suitable for Reserved Instances or Savings Plans
Weeks 9–12: Sustain and Formalize
Make initial commitment purchases with conservative parameters: 1-year terms, no upfront payment, covering the most stable workloads
Set budget alerts at 80% and 100% thresholds for each team's allocated spend
Publish the first monthly FinOps report to leadership covering spend trends, optimization actions taken, and measured savings
Document the FinOps operating model: who is responsible for what, review cadence, escalation paths, and decision authority
Key Takeaway
FinOps is not a destination with a finish line. It is an ongoing operational discipline. Begin with visibility, progress to systematic optimization, and build toward automated governance with engineering ownership. The framework scales from a single practitioner armed with a spreadsheet to a dedicated cross-functional team backed by enterprise-grade tooling. The constant through every scale is the principle: every dollar of cloud spend should be traceable to a business outcome, owned by a team, and continuously evaluated for efficiency.
All in One Place
Atler Pilot decodes your cloud spend story by bringing monitoring, automation, and intelligent insights together for faster and better cloud operations.