
AI usage can scale long before its costs become obvious. A few thousand additional requests, longer prompts, larger models, or an inefficient inference pipeline can quietly turn into a significant infrastructure bill.
That is why AI cost management needs more than a monthly invoice. You need visibility into what the AI is consuming, where it is being consumed, and why.
What is AI Usage Observability?
AI usage observability is the practice of continuously measuring how AI workloads consume models, tokens, compute, memory, and supporting infrastructure. Instead of looking only at the final cloud bill, it connects application-level usage with infrastructure-level consumption and cost.
For example, knowing that an application made 2 million API calls tells you very little by itself. Observability adds the context: which model handled those requests, how many input and output tokens were processed, how much GPU time was consumed, what the latency looked like, and what the workload ultimately cost.
This creates a much more useful picture of AI economics. Teams can move from “our AI spending increased this month” to “customer-support workloads generated 35% more inference requests, while average output tokens increased by 22%, driving most of the additional cost.”
Why Traditional Cloud Cost Monitoring is Not Enough
Traditional FinOps tools are good at showing infrastructure consumption across compute, storage, databases, networking, and other cloud services. AI workloads introduce another layer of complexity because the application itself determines a large part of the consumption pattern.
Two applications can run on the same infrastructure but have completely different AI costs. One may send short prompts to a smaller model, while another sends large contextual prompts to a more expensive model and generates lengthy responses. Looking only at GPU hours or cloud spend hides these differences.
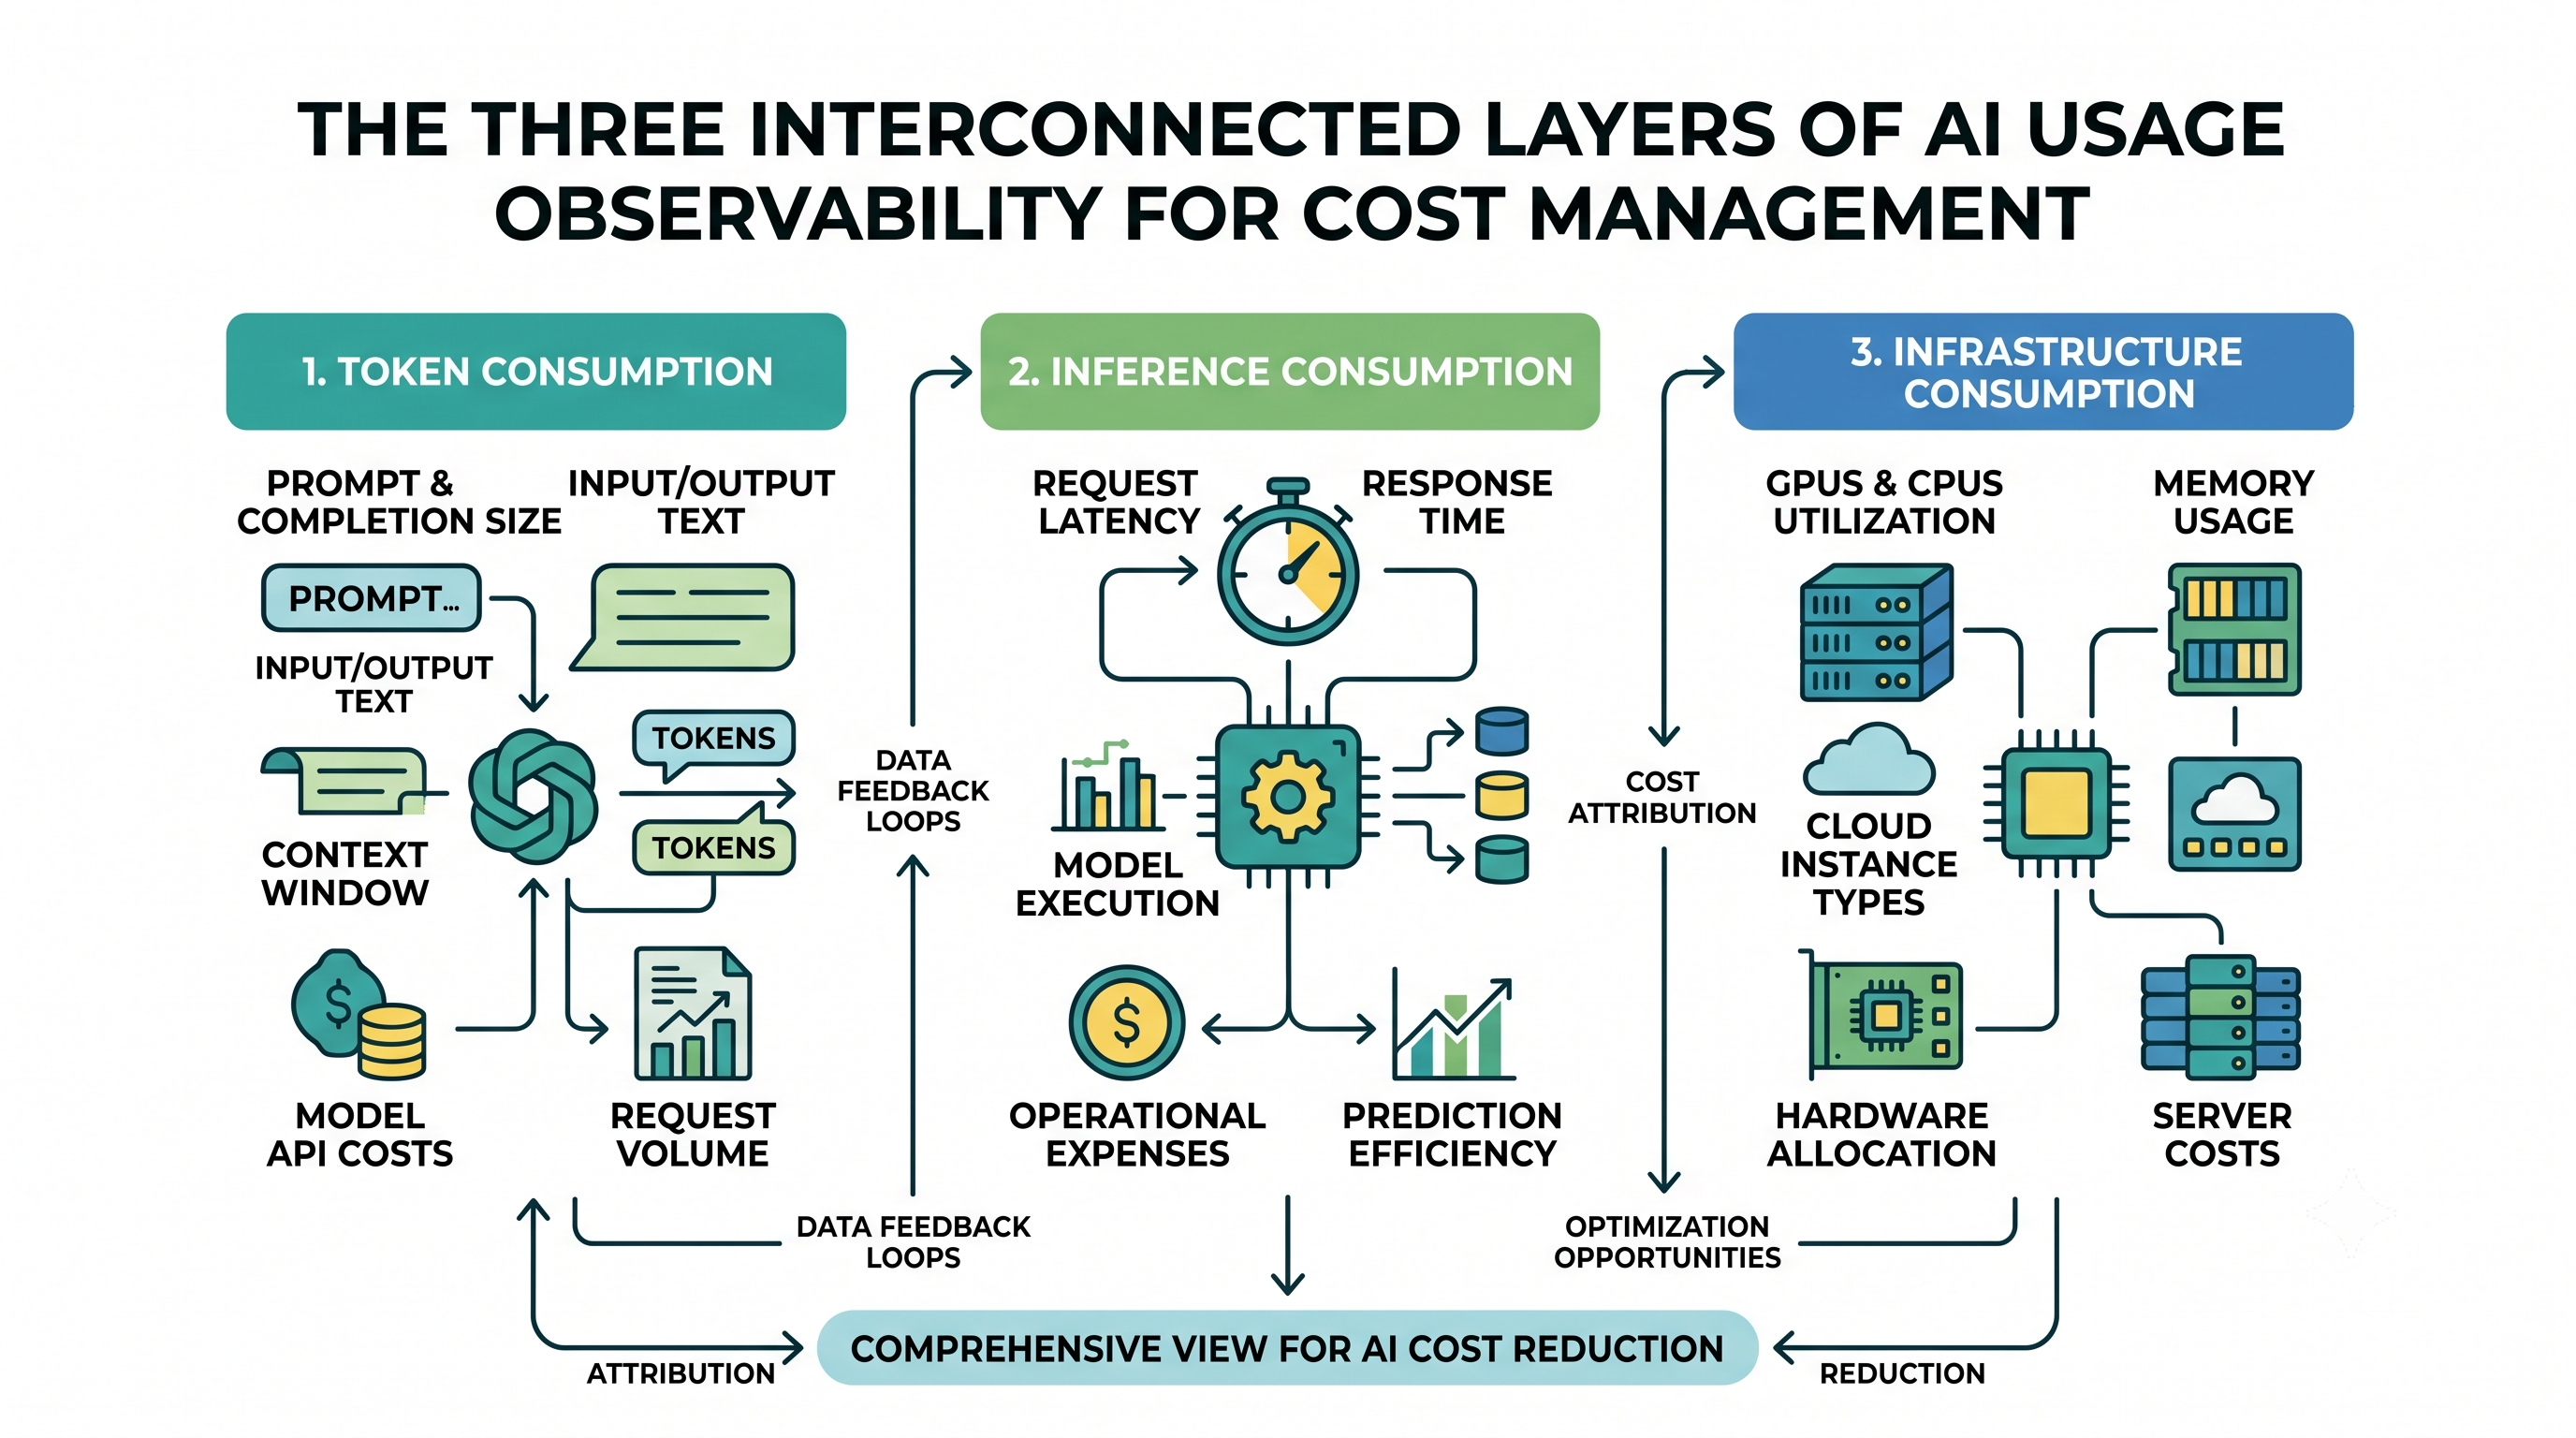
AI usage observability therefore needs to connect three layers: what the application is doing, what the model is processing, and what infrastructure is being consumed. Without this relationship, teams can identify that costs are rising but struggle to identify the actual workload responsible.
The Three Layers of AI Usage You Need to Track
A useful AI observability framework starts with three interconnected layers.
The first is token consumption. Track input tokens, output tokens, cached tokens where applicable, and total tokens by application, model, user, team, environment, or workload. Token patterns often reveal inefficient prompts, unnecessarily large context windows, or response-generation behavior that directly affects model costs.
The second is inference consumption. This includes request volume, model selection, inference latency, throughput, concurrency, retries, failures, and utilization. These metrics help explain how efficiently models are being used rather than simply how much they are being called.
The third is infrastructure consumption. For self-hosted or cloud-hosted models, this means monitoring GPU and CPU utilization, GPU memory, accelerator hours, instance types, autoscaling behavior, storage, networking, and related services. Together, these metrics show whether the underlying infrastructure is actually being used efficiently.
Token Tracking: The Starting Point for AI Cost Visibility
Tokens are one of the most important usage signals in AI because they provide a direct connection between application behavior and model consumption.
Teams should ideally track token usage at a granular level rather than treating the entire AI workload as one number. Useful dimensions include input versus output tokens, model, application, API endpoint, team, customer, environment, and time period.
This makes it possible to identify patterns that a simple cost report cannot. Suppose token consumption increases by 40%, but request volume only increases by 10%. That could indicate that prompts are becoming larger, conversations are retaining too much history, or generated responses have become longer.
The goal is not simply to reduce tokens. It is to understand why tokens are being consumed and determine whether that consumption is creating corresponding business value.
Inference Observability: Understanding What Happens Between Request and Response
Token metrics explain what is being processed. Inference metrics explain how efficiently it is being processed.
For production AI systems, teams should monitor metrics such as requests per second, tokens per second, time to first token, total response latency, queue time, concurrency, retry rates, and model utilization. These measurements become especially important when workloads are running on dedicated GPUs or self-hosted inference infrastructure.
For instance, low GPU utilization combined with high infrastructure costs can indicate over-provisioning. On the other hand, consistently saturated GPUs combined with increasing queue times may indicate that capacity needs to be adjusted.
This is where observability becomes more than cost tracking. It becomes a way to understand the operational efficiency of the AI system.
Infrastructure Consumption Can Tell a Different Story
AI infrastructure costs do not always move in line with application usage.
A workload might generate fewer requests but still consume more money because it has moved to a larger model or a more expensive GPU. Similarly, request volume might increase substantially without a proportional increase in infrastructure costs if the system is efficiently batching requests or improving accelerator utilization.
For self-hosted AI workloads, monitor GPU utilization, memory utilization, accelerator-hours, instance uptime, idle capacity, scaling events, and workload placement. For managed model services, connect inference activity and token usage with the corresponding service costs wherever the provider exposes those metrics.
The important point is to avoid treating infrastructure as a black box. Every GPU hour should have a workload behind it, and every workload should have a reason for consuming that capacity.
Connect AI Usage to Cost, Not Just Metrics
Observability becomes significantly more valuable when usage metrics can be translated into cost.
For each workload, teams should be able to answer questions such as:
How much did this application spend on inference?
What is the cost per 1,000 requests?
What is the cost per million tokens?
How much does one customer interaction cost?
Which model is generating the highest cost?
How much infrastructure is sitting idle?
How is cost changing as usage grows?
A useful AI cost model can therefore look something like:
AI Cost = Model/API Cost + Compute Cost + Memory Cost + Storage Cost + Network Cost + Supporting Service Cost
The exact components will vary depending on whether the organization uses managed APIs, dedicated inference endpoints, self-hosted models, or a hybrid architecture.
Cost per AI Request Is More Useful Than Total AI Spend
Total spending tells you the size of the problem. Unit economics tell you whether the system is becoming more or less efficient.
Consider an AI application whose monthly cost rises from $10,000 to $15,000. That sounds concerning until you discover that the number of successful AI interactions increased from 100,000 to 250,000 during the same period.
The more meaningful metric is cost per successful interaction:
Cost per Interaction = Total AI Cost ÷ Successful AI Interactions
You can build similar metrics for cost per workflow, cost per customer, cost per document processed, or cost per million tokens.
Tracking these metrics over time helps distinguish healthy growth from inefficient growth. If usage is increasing while unit cost is falling, the system may actually be becoming more efficient.
Model-Level Observability Helps Prevent Expensive Defaults
Model selection is another major cost driver.
Not every task requires the most capable or expensive model. A classification task, summarization workflow, or simple extraction request may be handled effectively by a smaller model, while complex reasoning may justify a more capable one.
Observability allows teams to compare models based on more than price. You can evaluate cost, latency, token consumption, throughput, quality, and task success rate together.
This creates the foundation for intelligent model routing. Instead of automatically sending every request to the most powerful model, applications can route requests according to complexity and business requirements.
The objective is not simply “use cheaper models.” It is “use the most economically appropriate model for each workload.”
Detecting AI Waste Requires Behavioral Signals
AI waste is often caused by application behavior rather than infrastructure configuration.
Common examples include oversized prompts, repeated context, unnecessary retries, excessive output generation, duplicate requests, abandoned inference calls, inefficient batching, and applications using expensive models for simple tasks.
These issues may not appear clearly in a traditional cloud cost report.
By correlating usage signals, observability platforms can identify unusual patterns such as a sudden increase in tokens per request, declining GPU utilization, repeated inference failures, or rapidly increasing requests from a particular service.
This turns anomaly detection into something actionable. Instead of simply flagging “AI spending is 25% above normal,” the system can identify which workload changed and which usage behavior caused the increase.
AI Usage Observability Should Be Multi-Dimensional
A single organization-wide AI usage number is rarely useful enough for decision-making.
Usage should be segmented across dimensions such as business unit, application, model, environment, customer, team, geography, project, and workload type.
This level of attribution answers an important FinOps question: Who is consuming the AI resources, and for what purpose?
It also makes chargeback and showback more practical. Engineering teams can see the infrastructure they are consuming, product teams can understand the economics of AI-powered features, and finance teams can connect those costs to business activity.
Build a Feedback Loop Between Engineering and FinOps
AI cost optimization works best when FinOps and engineering operate from the same data.
Engineering teams need technical signals such as latency, throughput, GPU utilization, token rates, and model performance. Finance teams need spend, forecasts, budgets, and unit economics. Product teams need to understand whether the cost of an AI feature is justified by its usage and business value.
AI observability can connect these perspectives.
For example, an increase in cost could trigger an investigation into prompt size, model selection, infrastructure utilization, or workload growth. The resulting optimization can then be measured through changes in cost per request or cost per successful outcome.
This creates a closed-loop optimization cycle: measure → attribute → detect → optimize → validate.
Forecasting AI Spend Requires Usage Drivers
Historical cloud spending alone is not enough to forecast AI costs accurately because AI consumption is often highly variable.
A better forecasting model incorporates operational drivers such as request volume, tokens per request, model mix, inference frequency, GPU utilization, workload growth, and expected changes in application adoption.
For example:
Forecast AI Cost = Forecast Requests × Expected Tokens per Request × Cost per Token
For infrastructure-based workloads, the model can additionally incorporate expected accelerator requirements, utilization rates, instance pricing, and scaling behavior.
This makes AI forecasting more dynamic. If expected application usage changes, the cost forecast can change with it.
Governance Should Happen Before the Bill Arrives
Observability becomes even more valuable when it feeds automated governance.
Organizations can establish thresholds for unexpected token growth, unusual inference activity, excessive GPU idle time, expensive model usage, or workload-level budget deviations.
For example, a governance system could flag an application when its cost per successful request exceeds an established threshold. It could also identify workloads that consistently consume dedicated GPU capacity while remaining significantly underutilized.
The best governance mechanisms do not simply block workloads. They provide context-aware guardrails that help teams make better decisions without slowing legitimate AI development.
What a Mature AI Observability Stack Should Provide
A mature implementation should bring application, model, infrastructure, and financial data together rather than monitoring each layer independently.
At a minimum, teams should be able to see:
Usage: requests, tokens, concurrency, throughput and workload volume.
Inference: latency, model utilization, failures, retries and performance.
Infrastructure: CPU/GPU utilization, memory, capacity, scaling and idle resources.
Cost: spend by model, workload, application, team and environment.
Unit economics: cost per request, interaction, workflow, customer or business outcome.
Forecasting: expected usage, future infrastructure requirements and projected spend.
Governance: budgets, thresholds, anomaly detection and automated corrective actions.
The real value comes from correlating these dimensions. A dashboard showing ten different metrics is not necessarily observability. Observability means being able to move from a financial or operational signal to its underlying cause.
The Future of AI Cost Management Is Usage-Aware
AI infrastructure is becoming increasingly dynamic. Models change, workloads fluctuate, context sizes grow, and applications can generate unpredictable inference patterns. As a result, managing AI economics through monthly invoices or static budgets will become increasingly ineffective.
The organizations that manage AI efficiently will be those that understand consumption at the workload level and continuously connect tokens → inference → infrastructure → cost → business value.
AI usage observability provides that missing layer of visibility. It allows teams to see not only how much AI costs, but what is driving the cost, whether the consumption is efficient, and where action can improve the economics.
Ultimately, the goal is not to make AI usage smaller.
It is to make every unit of AI consumption measurable, attributable, and justified by the value it creates.
All in One Place
Atler Pilot decodes your cloud spend story by bringing monitoring, automation, and intelligent insights together for faster and better cloud operations.