
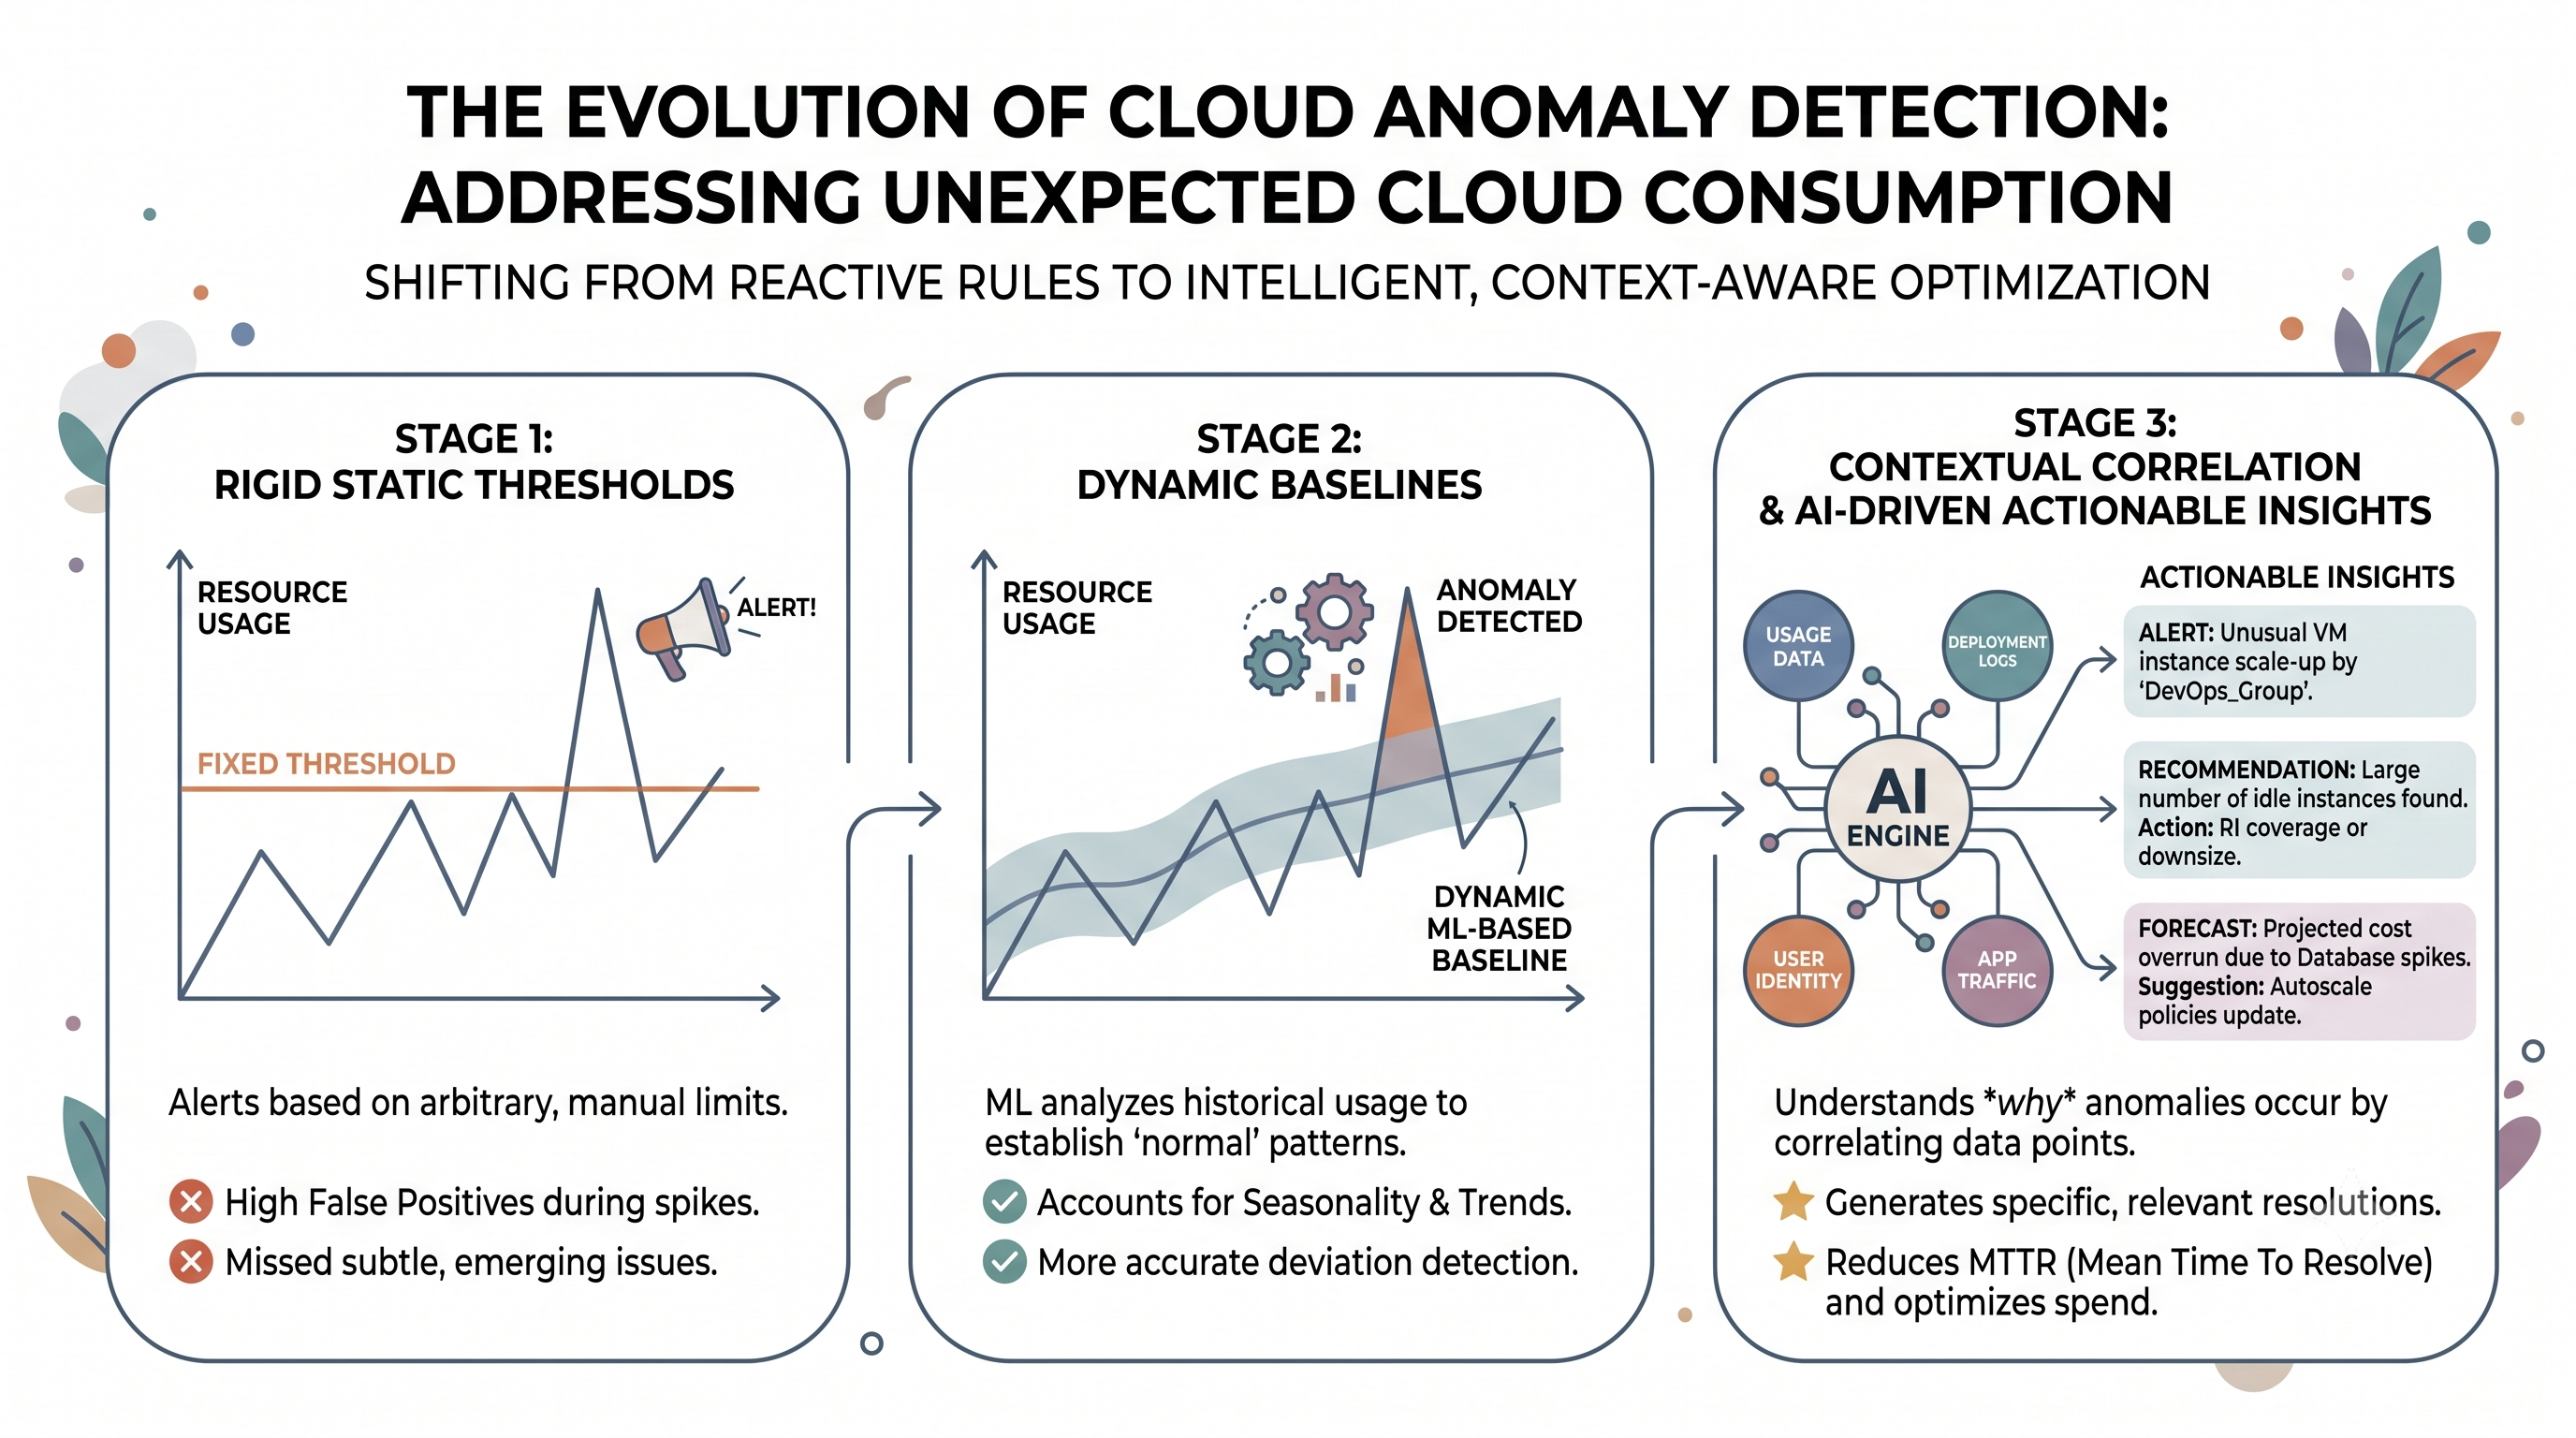
A cloud bill rarely becomes a problem when it crosses a predefined number. It becomes a problem when something changes unexpectedly and traditional thresholds are often too rigid to understand that change.
Modern cloud environments need anomaly detection that can recognize context, behavior, and patterns rather than simply asking whether a metric crossed a line.
Why Traditional Thresholds Are No Longer Enough
Threshold-based monitoring has been part of cloud operations for years. A team might define a rule such as, “Alert when daily cloud spend exceeds $10,000” or “Notify us when CPU utilization goes above 80%.”
The problem is that cloud consumption rarely behaves in such a predictable way.
A workload that normally spends $2,000 per day might suddenly consume $4,000 because of a deployment issue. A threshold of $10,000 would never detect it. Conversely, a legitimate month-end processing workload might temporarily push spending above $10,000 without representing a problem.
In both cases, the threshold only knows what number was reached. It does not understand what is normal for that workload.
That distinction is becoming increasingly important as organizations operate across multiple clouds, dynamic workloads, containers, serverless services, AI infrastructure, and rapidly changing application architectures.
From “Too High” to “Unexpected”
Modern anomaly detection starts with a different question:
Not “Is this cost high?” but “Is this behavior unusual?”
This shift sounds simple, but it fundamentally changes how cloud monitoring works.
Instead of defining a single acceptable value, an anomaly detection system can establish a baseline based on historical behavior. It can then compare current consumption against that baseline and identify statistically unusual changes.
For example, if a development environment typically spends between $300 and $400 each week but suddenly reaches $900, the system can recognize the deviation even though the organization-wide budget has not been exceeded.
This allows teams to identify problems before they become budget problems.
Establishing a Dynamic Cloud Baseline
The foundation of modern anomaly detection is a dynamic baseline.
A baseline represents the expected behavior of a workload under particular conditions. But cloud consumption can vary by day, hour, deployment cycle, season, business activity, and workload type.
Therefore, a useful baseline should account for these patterns rather than simply calculating an average.
For instance, an e-commerce workload may naturally consume more resources during weekends or promotional events. A data-processing workload may have predictable spikes every night. A development environment may show higher activity during working hours.
A sophisticated detection system learns these patterns and treats them as part of normal behavior.
The result is fewer false alarms and better identification of genuinely unexpected activity.
Context Matters More Than the Anomaly Score
An anomaly score by itself does not tell an engineer what to do.
Imagine receiving an alert that says:
“Cloud spend anomaly detected: +42%.”
That tells you something changed, but not what changed.
A more useful alert would provide context:
“Compute spending in the production analytics workload increased 42% over its expected baseline, primarily due to a 3.1× increase in GPU instance hours following a deployment.”
Now the anomaly becomes actionable.
This is one of the most important developments in cloud anomaly detection: moving from detection to explanation.
The system should help answer:
What changed?
When did it change?
Which workload caused it?
Which cloud resource was responsible?
How significant is the deviation?
Is this behavior historically unusual?
What could have triggered it?
What should the team investigate first?
Detecting Patterns Across Multiple Signals
Cloud anomalies rarely exist in isolation.
A sudden increase in cost might be accompanied by higher request volume, increased compute hours, changes in instance types, reduced utilization, or a deployment event.
Looking at these signals together can provide much stronger evidence than analyzing cost alone.
For example, suppose compute cost increases by 60%. On its own, that could indicate waste. But if application traffic also increased by 65%, the increase may simply reflect healthy business growth.
Now consider a different situation: cost increases by 60%, while traffic remains flat and CPU utilization falls. That pattern could indicate over-provisioning, an inefficient deployment, or resources that are running without delivering additional workload capacity.
Correlation turns an alert into an explanation.
Behavioral Anomalies vs. Financial Anomalies
Not every cloud anomaly appears directly as a cost spike.
A workload can become inefficient without immediately generating a large financial anomaly.
Consider a Kubernetes cluster where resource utilization gradually falls from 70% to 30%. Spending might remain relatively stable because the infrastructure is still provisioned. The problem is not necessarily an immediate cost spike—it is deteriorating efficiency.
Similarly, an application could suddenly begin making significantly more API calls while each request consumes more compute. The financial impact may only become visible later.
This is why modern anomaly detection should monitor behavioral anomalies as well as financial anomalies.
Changes in utilization, request patterns, resource allocation, token consumption, storage growth, and infrastructure efficiency can all be early indicators of future cost problems.
Time-Series Intelligence Makes Detection More Precise
Cloud consumption is fundamentally a time-series problem.
A system needs to understand how a metric behaves over time and distinguish normal variation from meaningful deviation.
Modern approaches can use statistical methods and machine-learning techniques to analyze trends, seasonality, volatility, and historical patterns. Rather than comparing today's spending with a fixed threshold, the system can estimate an expected range and determine whether the current observation falls outside that range.
This becomes particularly useful for organizations with highly variable workloads.
Instead of:
Spend > $5,000 → Alert
the logic becomes closer to:
Actual spend significantly exceeds expected spend for this workload, given its historical pattern and current activity → Investigate.
That is a much more intelligent approach to cloud monitoring.
Anomaly Detection Needs Resource-Level Attribution
Organization-wide anomaly detection is useful for identifying that something is wrong. It is much less useful for finding the root cause.
Cloud environments can contain thousands of resources, accounts, subscriptions, projects, clusters, services, and workloads.
If the total cloud bill increases by 20%, the investigation can quickly become complicated.
Resource-level attribution narrows the problem.
The system should be able to trace an anomaly from:
Organization → Cloud → Account → Environment → Application → Service → Resource
This allows teams to move from a high-level financial signal to the specific workload responsible for the change.
The same principle applies to shared infrastructure. If several applications use the same cluster or data platform, cost allocation needs to understand consumption at a granular level rather than assigning the entire bill to one team.
AI Is Changing What Anomaly Detection Can Do
AI and machine learning are increasingly being used to identify complex relationships that are difficult to capture with static rules.
Instead of monitoring one metric at a time, intelligent systems can evaluate multiple signals simultaneously and recognize combinations that indicate unusual behavior.
For example, a model might identify that:
request volume is stable,
token consumption is rising,
average response size has increased,
GPU utilization has decreased,
and cost per transaction has doubled.
No single metric necessarily looks catastrophic. Together, however, they reveal a significant efficiency problem.
This is where AI-assisted anomaly detection can move beyond simple statistical alerts toward pattern recognition and contextual reasoning.
The technology is not valuable because it adds “AI” to monitoring. It is valuable when it can reduce noise, identify meaningful relationships, and help teams understand what deserves attention.
Reducing False Positives Is Just as Important as Finding Anomalies
One of the biggest challenges with anomaly detection is alert fatigue.
If engineers receive dozens of alerts every day, they eventually stop treating them as meaningful signals.
A mature system therefore needs to distinguish between statistical unusualness and operational significance.
A small deviation in a low-cost development environment may not deserve immediate attention. A smaller deviation in a critical production workload may deserve investigation because of its business impact.
This means anomaly detection should consider factors such as:
Magnitude of deviation
Financial impact
Resource criticality
Historical behavior
Business importance
Duration of the anomaly
Rate of change
Confidence in the detection
The objective is not to generate more alerts.
It is to generate fewer, better alerts.
From Detection to Root-Cause Analysis
The next stage in anomaly detection is automated investigation.
Once an anomaly is detected, systems can compare recent changes against deployments, configuration changes, resource modifications, traffic patterns, pricing changes, and workload behavior.
For example, an anomaly might coincide with:
10:05 AM: New deployment
10:12 AM: Instance count increases
10:18 AM: GPU utilization falls
10:30 AM: Cost begins exceeding baseline
This timeline gives engineers a much stronger starting point than a generic cost alert.
The goal is to reduce the time between “something looks wrong” and “we know what probably caused it.”
Anomaly Detection Should Feed Forecasting
Anomaly detection and forecasting are often treated as separate capabilities, but they work better together.
Forecasting estimates where consumption is heading. Anomaly detection identifies when actual behavior begins deviating from expectations.
Suppose projected monthly spending is $100,000. If an unexpected workload change causes daily consumption to rise significantly, anomaly detection can identify the deviation while forecasting recalculates the expected month-end outcome.
This creates an important feedback loop:
Baseline → Detect deviation → Recalculate forecast → Assess impact → Take action
Instead of waiting until the end of the billing period to discover that a budget will be exceeded, teams can understand the potential impact while there is still time to respond.
From Alerts to Automated Guardrails
The evolution does not stop at detection.
Once organizations have sufficient confidence in their anomaly signals, they can connect them to governance mechanisms.
For low-risk scenarios, this might mean automatically notifying the responsible team. For more controlled environments, it could trigger actions such as scaling down unused resources, pausing non-production workloads, adjusting capacity, or requiring approval for certain high-cost configurations.
However, automation should be implemented carefully.
Not every anomaly is waste. A sudden increase in compute may be caused by a legitimate business event. Automated remediation therefore needs contextual policies, confidence levels, and appropriate safeguards.
The goal is controlled automation, not blindly allowing a system to shut down anything that looks unusual.
What Modern Cloud Anomaly Detection Should Look Like
A mature anomaly detection capability should ideally provide more than a red alert on a dashboard.
It should combine:
Dynamic baselines to understand expected behavior.
Multi-dimensional detection across accounts, services, workloads, and resources.
Behavioral analysis to identify unusual consumption before it becomes expensive.
Contextual correlation across cost, utilization, traffic, deployments, and infrastructure.
Root-cause analysis to explain what changed and why.
Financial impact analysis to prioritize anomalies by actual business significance.
Forecast integration to understand how anomalies may affect future budgets.
Governance guardrails to help prevent repeated or escalating issues.
Together, these capabilities transform anomaly detection from a monitoring feature into an active cloud management mechanism.
The Real Evolution: From Monitoring to Understanding
Cloud anomaly detection is moving through a clear progression.
First came thresholds:
“Tell me when this number is too high.”
Then came alerts:
“Tell me when something unusual happens.”
Now the requirement is much broader:
“Tell me what changed, why it changed, what it means financially, and what I should do about it.”
That is the real evolution beyond thresholds.
As cloud environments become more distributed, dynamic, and AI-driven, organizations cannot depend on static rules to understand constantly changing consumption. They need systems that learn normal behavior, recognize deviations, connect anomalies to their underlying causes, and translate technical changes into financial impact.
The future of cloud anomaly detection is therefore not about creating more sophisticated alerts.
It is about creating enough intelligence around an anomaly that the anomaly becomes a decision.
All in One Place
Atler Pilot decodes your cloud spend story by bringing monitoring, automation, and intelligent insights together for faster and better cloud operations.