
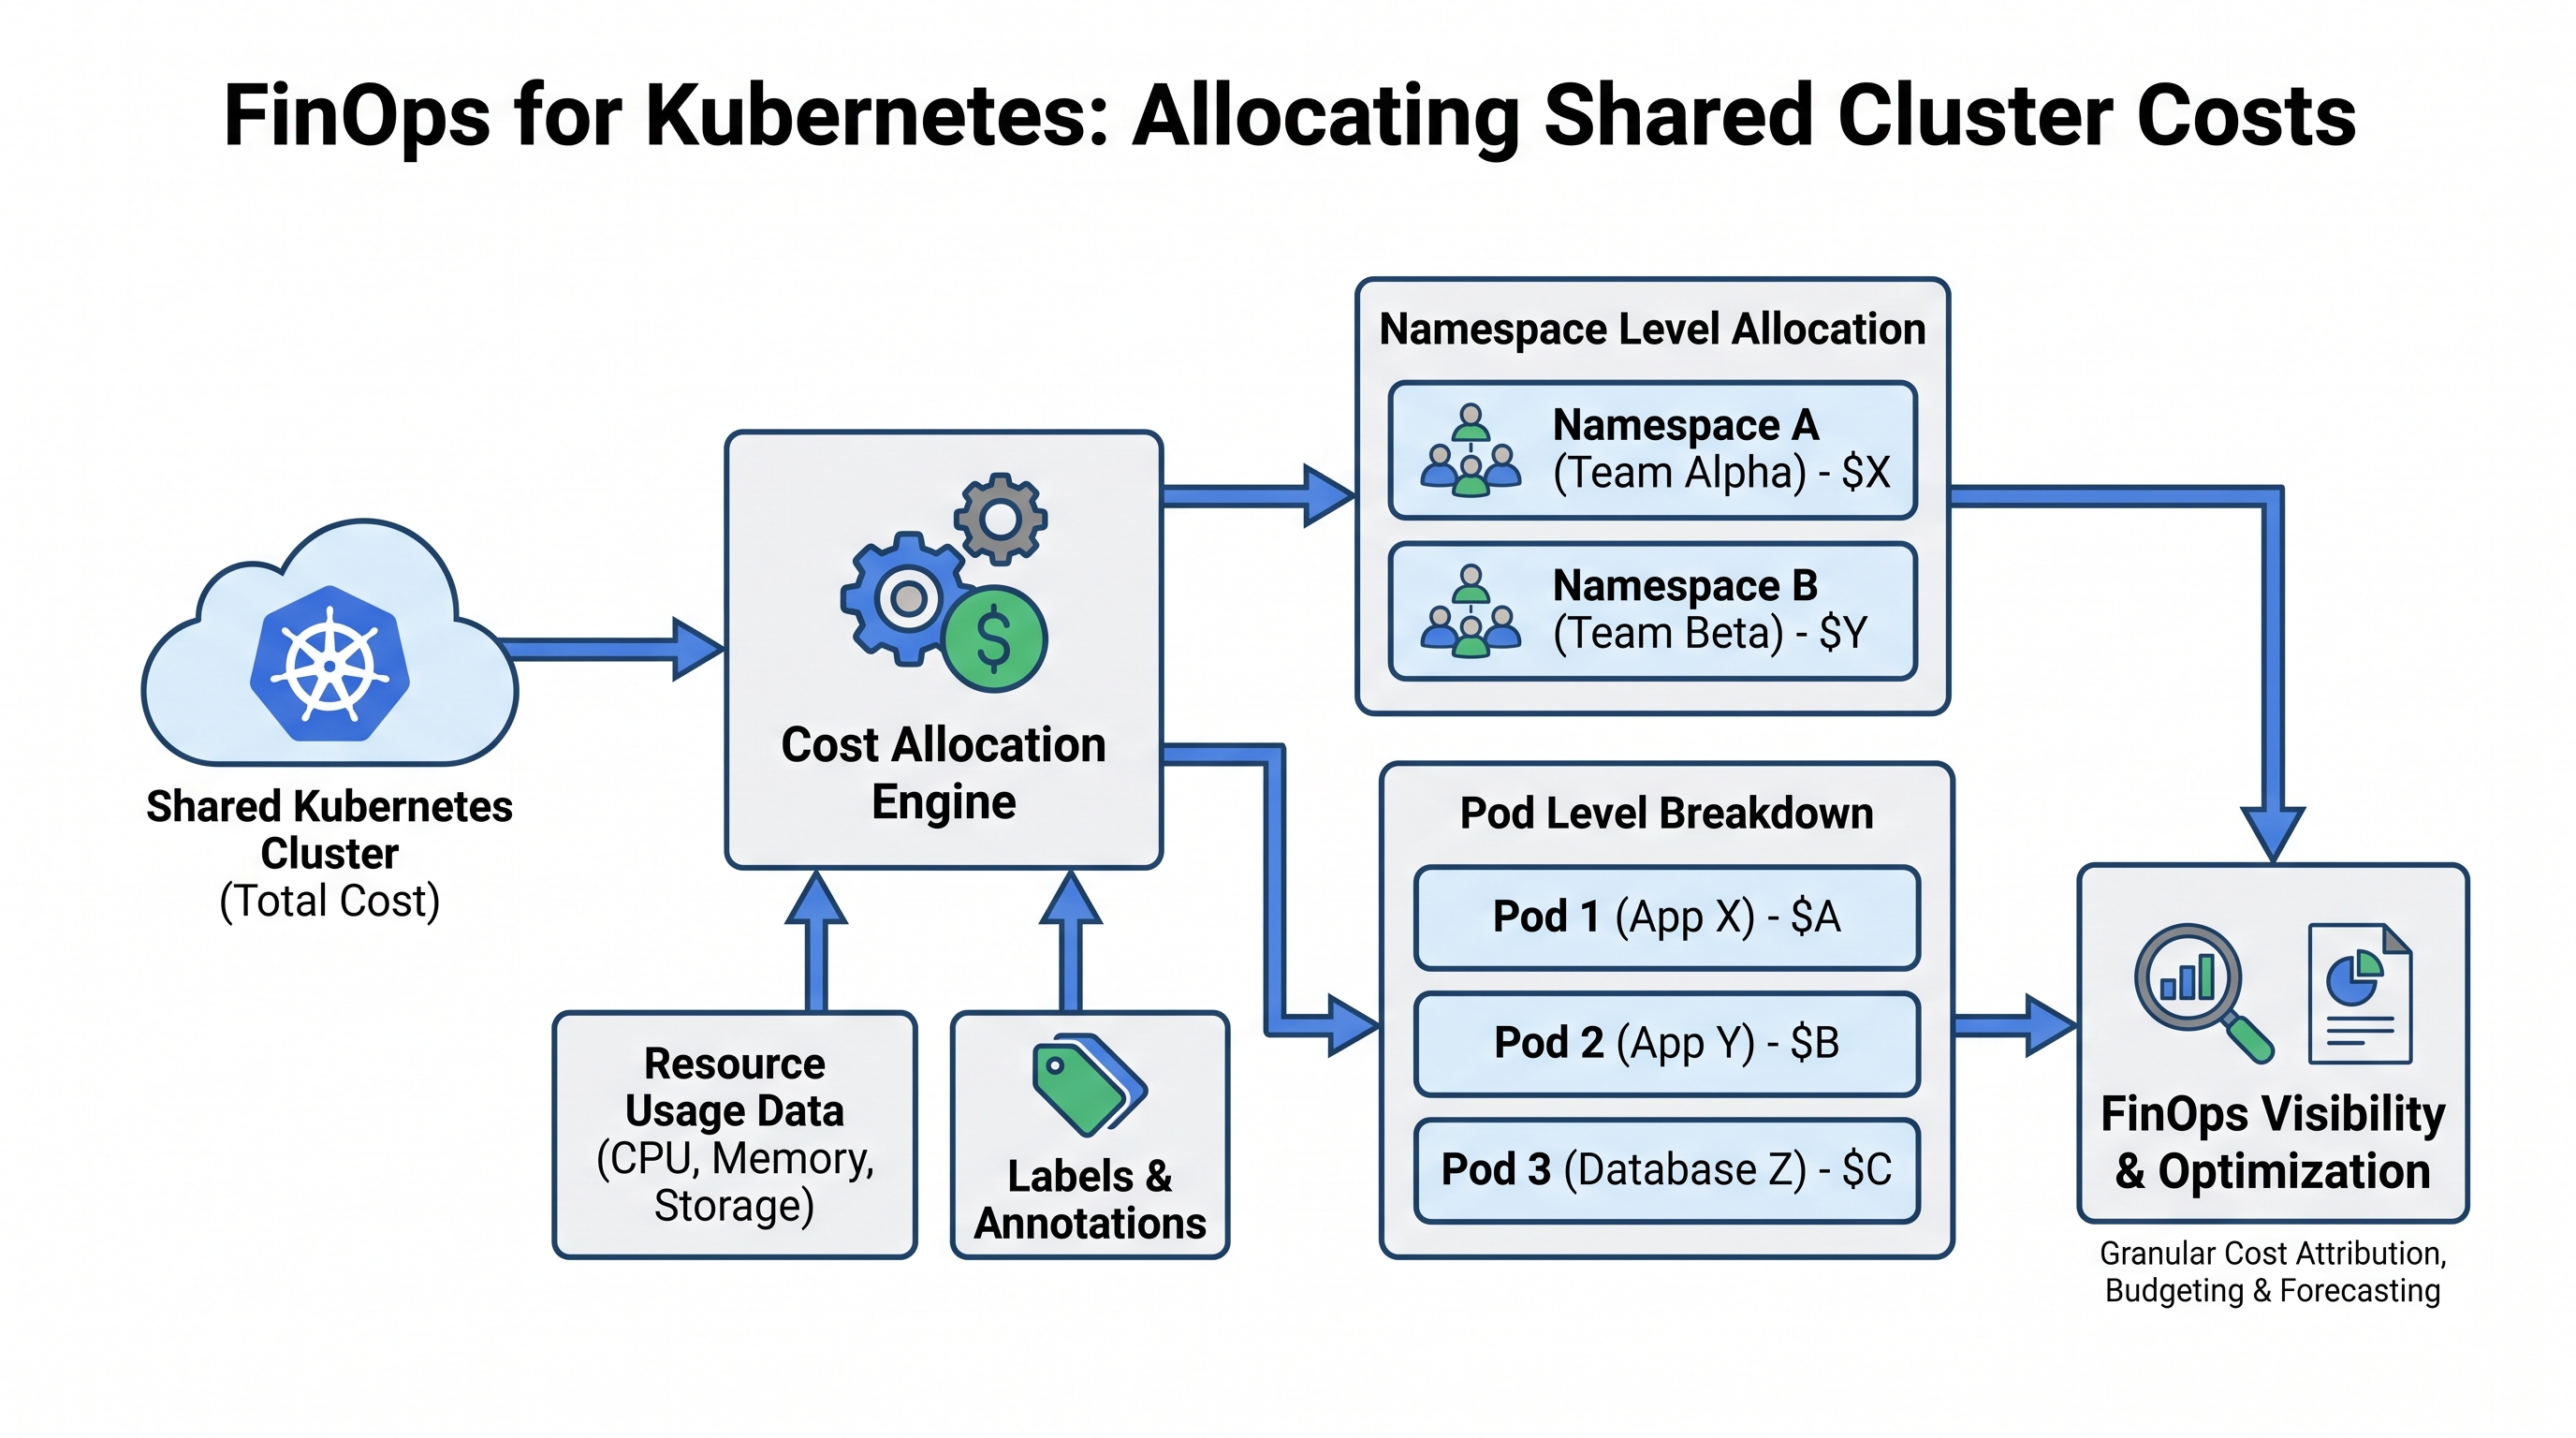
The Kubernetes Cost Visibility Crisis
Kubernetes has revolutionized container orchestration, allowing engineering teams to deploy microservices at scale with unprecedented velocity. However, this dynamic scheduling paradigm introduces a major challenge for finance and operations teams: the complete loss of granular cost visibility. In a traditional virtual machine architecture, cost allocation is straightforward—a VM is assigned to a specific cost center, and its monthly cost is billed directly to that team. In Kubernetes, a single node (VM) can host dozens of pods belonging to different applications, environments, and business units. The cloud provider's invoice only shows the cost of the underlying virtual machine instance, leaving the internal distribution of those costs a complete mystery.
This "black box" problem is the core driver behind the rapid adoption of Kubernetes FinOps. Without precise cost allocation, organizations face several critical challenges:
Inability to Charge Back or Show Back: Finance departments cannot accurately assign cloud bills to the business units responsible for generating the traffic.
Uncontrolled Idle Capacity: Over-provisioned pods sit idle, consuming budget without delivering business value, while their costs are hidden within the overall cluster spend.
Inaccurate Unit Economics: Product teams cannot calculate the true cost of goods sold (COGS) for a specific user transaction or customer tenant.
To solve this crisis, enterprise engineering teams must implement a robust cost allocation model that maps raw infrastructure costs to Kubernetes primitives like namespaces, labels, controllers, and individual pods. Unifying these container-level insights with broader multi-cloud billing requires a comprehensive enterprise financial operations platform capable of normalizing billing data across AWS, Azure, GCP, and Oracle environments.
The Anatomy of Kubernetes Costs
Before diving into allocation formulas, it is essential to understand the different components that make up a Kubernetes cluster's total cost. A cluster does not just consume CPU and memory on its worker nodes; it also incurs costs from storage, network egress, management fees, and shared cluster-wide services.
1. Compute Costs (CPU, Memory, and GPU)
Compute resources represent the largest share of Kubernetes spend. These resources are billed by the cloud provider based on the instance type (e.g., AWS m5.xlarge, GCP n2-standard-4). Inside the cluster, these resources are allocated to pods based on two distinct metrics: Requests and Usage.
Requests: The minimum amount of CPU and memory the Kubernetes scheduler guarantees to a container. If a pod requests 2 vCPUs, the scheduler reserves 2 vCPUs on a node for that pod, regardless of whether the pod actually uses them. The cloud provider bills for this reserved capacity.
Usage: The actual amount of CPU and memory consumed by the container during runtime. Usage fluctuates dynamically based on application traffic and workload demands.
This distinction is critical for FinOps. If a pod has a memory request of 8 GiB but only uses 1 GiB, the remaining 7 GiB is idle capacity. Because the scheduler cannot assign that 7 GiB to other pods (unless overcommit is permitted and safe), the application owning that pod must be held financially accountable for that idle capacity.
2. Storage Costs
Storage in Kubernetes is typically provisioned via Persistent Volumes (PVs) backed by cloud block storage (e.g., AWS EBS, Azure Managed Disks). These costs are relatively easy to track because PVs are bound to specific Persistent Volume Claims (PVCs) within a namespace. However, local ephemeral storage (the node's root disk used for container writable layers and emptyDir volumes) must also be accounted for and allocated proportionally based on pod disk usage.
3. Network Egress and Inter-AZ Transfer
Network costs are often the most difficult to allocate. While ingress (data entering the cluster) is usually free, cloud providers charge heavily for:
Internet Egress: Data sent from pods to the public internet.
Inter-Availability Zone (Cross-AZ) Transfer: Data sent between pods or services located in different AZs within the same cloud region.
Because standard Kubernetes networking abstracts IP addresses and routes traffic through shared services (like kube-proxy or ingress controllers), attributing network egress to a specific namespace requires advanced packet tracking or eBPF (Extended Berkeley Packet Filter) telemetry.
4. Shared Overhead and Control Plane Fees
Managed Kubernetes services charge a flat hourly rate for the control plane (e.g., $0.10/hour for AWS EKS or GCP GKE). Additionally, clusters run system-level daemonsets and controllers—such as ingress controllers (NGINX, Traefik), logging agents (Fluentbit), monitoring agents (Prometheus node-exporter), and security tools—that consume resources but do not belong to any single application team. These are considered "shared overhead" and must be distributed fairly across all tenant namespaces.
Mathematical Models for Cost Allocation
To accurately allocate costs down to the pod level, we must define a clear mathematical framework. The total cost of a node ($C_{Node}$) over a given billing period must be completely distributed across the pods running on that node, plus any unallocated idle space.
The Basic Allocation Formula
The cost of an individual pod ($C_{Pod}$) on a specific node is calculated as the sum of its CPU cost, Memory cost, GPU cost, and storage cost:
C_Pod = (Allocated_CPU_Ratio C_Node_CPU) + (Allocated_Mem_Ratio C_Node_Mem) + C_Pod_GPU + C_Pod_Storage
To calculate the Allocated_CPU_Ratio, we must resolve the conflict between "Requests" and "Usage". The industry standard, defined by the FinOps Foundation, is to use the maximum of requests and usage for allocation. This ensures that if a pod requests resources and blocks other workloads from using them, it is billed for them; conversely, if a pod has no requests (or low requests) but bursts and uses substantial resources, it is billed for its actual consumption:
Allocated_Resource_Pod = Max(Resource_Request_Pod, Resource_Usage_Pod)
Using this principle, the allocation ratio for CPU for a pod on a given node is:
Allocated_CPU_Ratio = Max(CPU_Request_Pod, CPU_Usage_Pod) / Total_Node_Capacity_CPU
Handling Node Idle Capacity
A physical or virtual node is rarely 100% utilized. The difference between the sum of all allocated pod resources and the total capacity of the node is the Node Idle Capacity:
Idle_Capacity_Node = Total_Node_Capacity - Sum(Max(Resource_Request_Pod, Resource_Usage_Pod))
FinOps practitioners have two primary methods for dealing with the cost of this idle capacity:
Proportional Distribution (Shared Idle): The idle cost is distributed across all pods running on that node (or across the entire cluster) proportional to their allocated resources. This incentivizes teams to rightsize their workloads, as higher requests lead to a larger share of the idle penalty.
Separate Idle Allocation: Idle costs are isolated and billed to a central "Platform Infrastructure" cost center. This prevents application teams from being penalized for cluster autoscaling decisions or system-level over-provisioning managed by the platform team.
Implementing these complex allocation models requires a high-performance cost impact calculation engine that can ingest millions of metric data points and correlate them with real-time cloud provider pricing APIs.
Gathering the Data: Prometheus, OpenCost, and Metrics Architecture
To execute these mathematical models, we need continuous, highly granular telemetry from the Kubernetes cluster. The standard open-source architecture for gathering this data relies on Prometheus, kube-state-metrics, and cAdvisor (which is embedded in the Kubelet).
Kubernetes Worker NodePod A (Namespace: Payment)CPU Request: 500mMemory Request: 1GiPod B (Namespace: Search)CPU Request: 1000mMemory Request: 2GiKubelet (cAdvisor)Shared DaemonSet (e.g., Fluentbit, Prom-Exporter)Consumes CPU/Mem without direct business ownershipPrometheus ServerPromQL EngineScrapes Node Metricsand Pod resource usage
Essential PromQL Queries for Cost Calculation
To feed your cost allocation engine, you must extract resource usage metrics from Prometheus. Below are the core PromQL queries used to calculate allocated CPU and Memory.
1. CPU Usage per Pod (Rate over 5 minutes)
sum(rate(container_cpu_usage_seconds_total{container!="", container!="POD"}[5m])) by (namespace, pod, node)
This query measures the actual CPU cores consumed by each container (excluding the pause container) aggregated up to the pod level, grouped by namespace and node.
2. CPU Requests per Pod
sum(kube_pod_container_resource_requests{resource="cpu", container!="", container!="POD"}) by (namespace, pod, node)
This query extracts the static CPU request defined in the pod manifest. This represents the capacity reserved by the scheduler on the host node.
3. Memory Working Set Bytes (Actual Memory Usage)
sum(container_memory_working_set_bytes{container!="", container!="POD"}) by (namespace, pod, node)
We use container_memory_working_set_bytes rather than container_memory_usage_bytes because the working set includes active memory that cannot be easily released by the kernel, making it the most accurate representation of memory pressure on the node.
4. Memory Requests per Pod
sum(kube_pod_container_resource_requests{resource="memory", container!="", container!="POD"}) by (namespace, pod, node)
Correlating Metrics with Cloud Billing APIs
Gathering utilization metrics is only half the battle. To assign actual currency values to these metrics, your system must dynamically query the cloud provider's billing APIs (e.g., AWS Price List API, Google Cloud Billing API) to determine the exact hourly rate of the node instance types running in your clusters. This includes accounting for:
On-Demand vs. Spot Pricing: Spot instances can cost up to 90% less than on-demand instances. Your allocation engine must identify if a node is a spot instance (via labels like
eks.amazonaws.com/capacity-type: SPOT) and apply the correct discounted rate.Savings Plans and Reserved Instances: Enterprise organizations often purchase compute commitments. A mature cost allocation model must apply these amortized discounts down to the individual pods using commitment intelligence to ensure that teams benefit fairly from company-wide purchasing power.
Allocating Shared Overhead and System Costs
Once you have allocated compute costs to individual workload pods, you are left with a pool of shared costs that do not have a direct business owner. These shared costs fall into three main categories: system namespaces, control plane fees, and idle capacity. If left unallocated, these costs accumulate in a "black hole," distorting the accuracy of your financial reporting.
System Namespaces (The kube-system Problem)
Every cluster runs foundational services in namespaces like kube-system, ingress-nginx, or monitoring. These pods are essential for the cluster to function, but they exist solely to support the application workloads running in other namespaces.
The standard architectural pattern for distributing these costs is the Proportional Redistribution Model. In this model, the total cost of all system namespaces is summed up and then reallocated to the business namespaces based on their share of the total cluster spend. Let's look at a concrete example:
Namespace | Direct Cost | % of App Cost | Allocated System Overhead | Total Allocated Cost |
|---|---|---|---|---|
kube-system (Shared) | $200.00 | - | -$200.00 (Distributed) | $0.00 |
payment-prod | $500.00 | 62.5% | +$125.00 | $625.00 |
search-prod | $300.00 | 37.5% | +$75.00 | $375.00 |
Total Cluster | $1,000.00 | 100% | $0.00 | $1,000.00 |
Using this method, the system overhead is completely drained, and the true cost of running the payment-prod service is accurately represented as $625.00 instead of just its raw direct compute cost of $500.00.
Implementing Labels and Annotations for Metadata-Driven Allocation
To automate this allocation at scale, organizations must enforce strict tagging policies. Kubernetes namespaces and workloads should be decorated with standardized labels that map directly to company cost centers, business units, and environments.
Here is an example of an enterprise-grade namespace manifest utilizing standardized metadata:
apiVersion: v1
kind: Namespace
metadata:
  name: payment-prod
  labels:
    cloudatler.com/cost-center: "cc-8840"
    cloudatler.com/business-unit: "fintech-transactions"
    cloudatler.com/environment: "production"
    cloudatler.com/owner: "payment-platform-team"
  annotations:
    cloudatler.com/shared-cost-strategy: "proportional"
    cloudatler.com/idle-cost-policy: "chargeback"
With these labels in place, a downstream billing engine can ingest these Kubernetes objects, parse the labels, and automatically construct accurate billing records. For organizations running complex multi-cluster topologies across multiple clouds, leveraging automated tagging and resource classification is critical to maintaining a clean metadata lineage from raw cloud billing exports down to individual containers.
Advanced Optimization: Idle Capacity and Workload Rightsizing
Once you have achieved accurate cost allocation down to the pod level, the next step in the FinOps lifecycle is optimization. Allocation reveals the waste; optimization eliminates it.
1. Analyzing the Request vs. Usage Gap
The most common source of waste in Kubernetes is over-provisioning. Developers, fearing out-of-memory (OOM) kills or CPU throttling, frequently set resource requests far higher than their workloads actually require. This creates massive idle capacity on the nodes.
To identify these optimization opportunities, we can calculate the Efficiency Score of a workload:
Efficiency_Score = (Average_CPU_Usage / CPU_Request) * 100
If a workload consistently exhibits an efficiency score below 20%, it is a prime candidate for rightsizing. FinOps teams should implement automated policies to adjust these requests.
2. Implementing Vertical Pod Autoscaler (VPA) and LimitRanges
To prevent developers from creating massively oversized pods, platform teams can enforce resource guardrails using Kubernetes LimitRanges. A LimitRange sets default, minimum, and maximum resource limits within a namespace:
apiVersion: v1
kind: LimitRange
metadata:
  name: payment-limits
  namespace: payment-prod
spec:
  limits:
  - default:
      cpu: "500m"
      memory: "512Mi"
    defaultRequest:
      cpu: "200m"
      memory: "256Mi"
    max:
      cpu: "2"
      memory: "4Gi"
    min:
      cpu: "50m"
      memory: "64Mi"
    type: Container
By enforcing these guardrails, platforms can automatically govern resource allocation and prevent costly runaway workloads.
Conclusion
Achieving cost visibility in a Kubernetes environment requires a strategic combination of robust telemetry, standardized metadata, and advanced mathematical allocation models. By decomposing cluster costs down to the namespace and pod level, organizations can transition from a "black box" billing model to one of total financial transparency.
This FinOps maturity not only enables accurate chargebacks but also drives a culture of engineering efficiency. With clear insights into idle capacity and workload rightsizing opportunities, engineering teams can continuously optimize their infrastructure footprint, maximizing the return on investment for their cloud-native transformation.
All in One Place
Atler Pilot decodes your cloud spend story by bringing monitoring, automation, and intelligent insights together for faster and better cloud operations.