
The Modern Multi-Cloud Operational Crisis: Why Manual Routing Fails
As enterprise cloud footprints expand across AWS, Azure, GCP, and Oracle Cloud Infrastructure (OCI), operational complexity grows exponentially. A single distributed application can span multiple cloud providers, utilizing managed Kubernetes services, serverless functions, relational databases, and global content delivery networks. When an anomaly occurs, it rarely presents as a single, clean alert. Instead, it triggers an alert storm across disparate monitoring systems—Datadog, AWS CloudWatch, Azure Monitor, and Prometheus.
Traditional IT Service Management (ITSM) workflows rely on static, rule-based routing to triage these alerts into tickets. These rules typically parse basic metadata such as resource tags, severity fields, or alert names. However, in a dynamic multi-cloud environment, this approach fails for several critical reasons:
Lack of Topological Context: Rule-based systems cannot correlate an alert from an Azure API Gateway with a downstream database latency spike on an AWS RDS instance. As a result, tickets are routed to separate teams, leading to duplicate triage efforts and finger-pointing.
Stale Routing Tables: Cloud infrastructure changes continuously. Static routing rules that map specific resource groups to particular engineering teams quickly become outdated, resulting in misrouted tickets and inflated Mean Time to Acknowledge (MTTA).
Alert Fatigue and Noise: Without intelligent deduplication and correlation, high-volume, low-severity warnings flood the queue, burying critical security and operational incidents.
The Siloed Operations Gap: Traditional ticketing systems operate independently of financial and security governance models. An operational incident—such as an over-provisioned virtual machine cluster scaling out of control—directly impacts the organization's cloud budget, yet standard ITSM processes rarely flag the FinOps implications in real time.
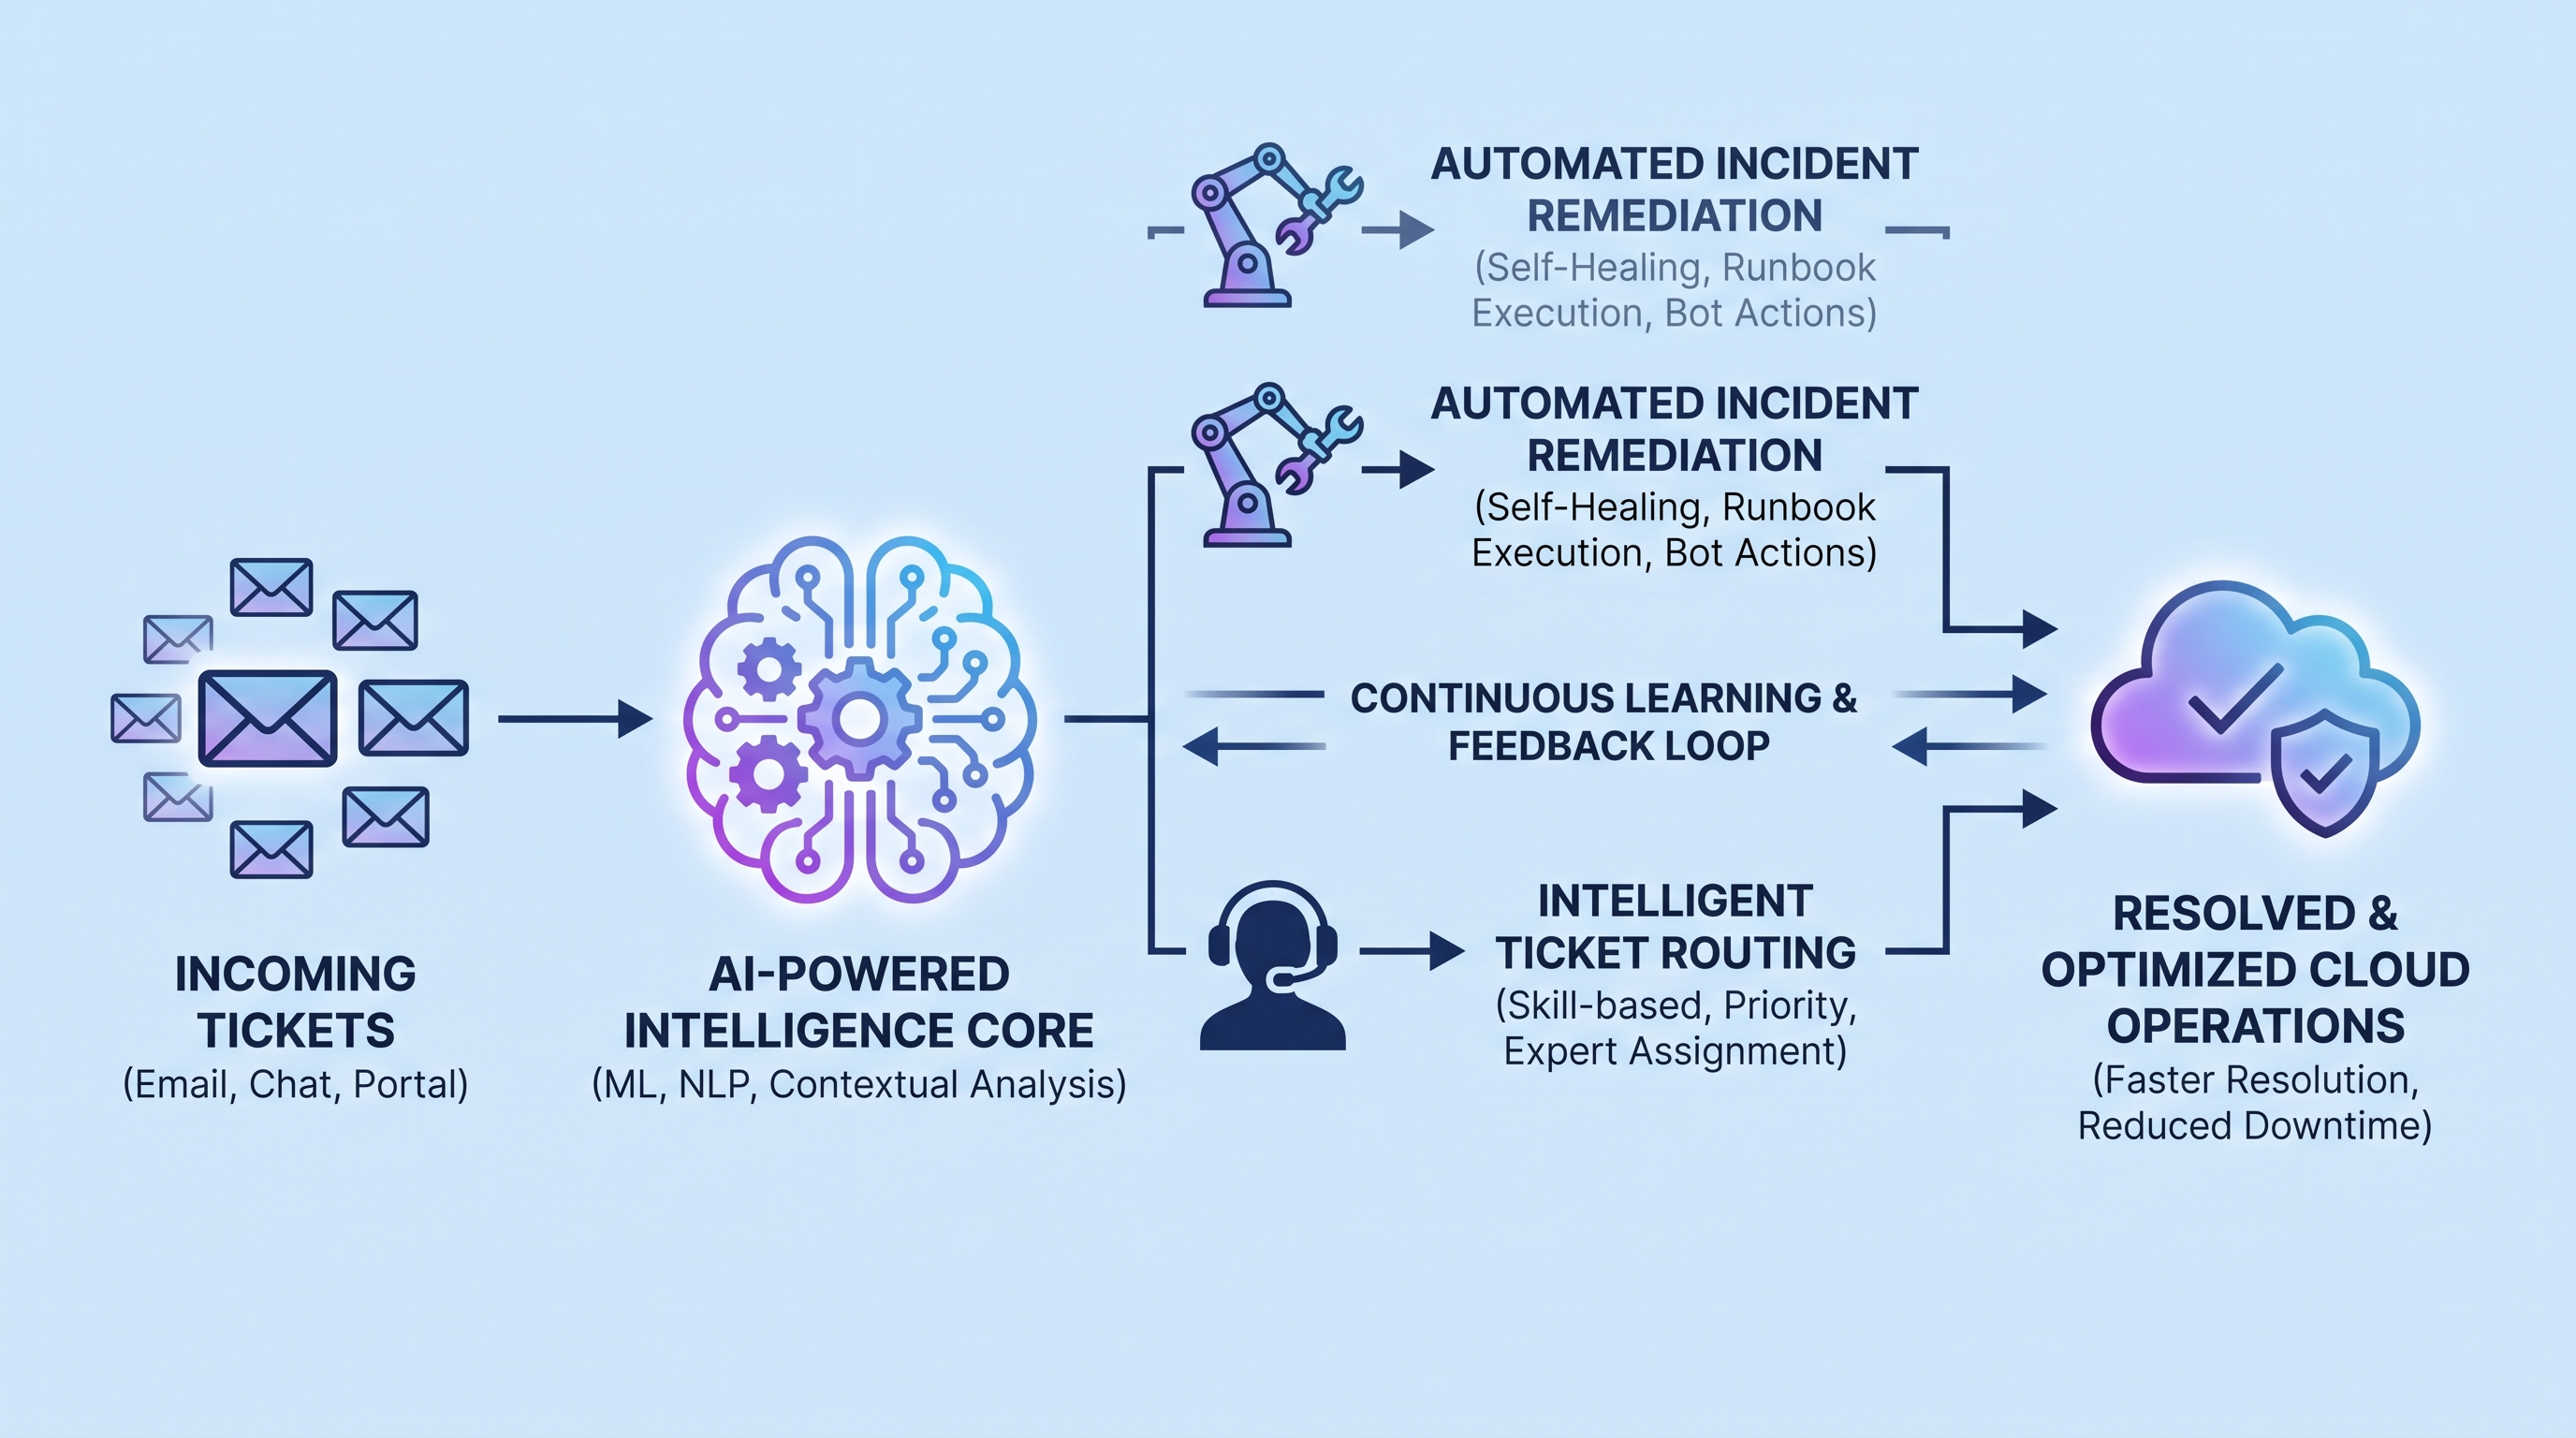
To overcome these challenges, enterprise organizations must transition from reactive, manual routing to proactive, AI-driven operational intelligence. By leveraging machine learning models trained on cloud topology, historical ticket resolutions, and real-time telemetry, organizations can automate both the routing of complex incidents and their downstream remediation.
Architectural Deep-Dive: AI-Driven Ticket Routing
Implementing an intelligent routing engine requires a decoupled, event-driven architecture capable of ingesting high-throughput telemetry, executing real-time natural language processing (NLP), and mapping incident context to the correct resolution path. Below is a conceptual representation of this architecture, showing how raw telemetry is transformed into structured, actionable, and automatically routed incidents.
+-----------------------------------------------------------------------------------------+
|                               MULTI-CLOUD TELEMETRY SOURCES                            |
|    [AWS CloudWatch]       [Azure Monitor]       [GCP Operations]      [OCI Logging]     |
+------------------------------------+----------------------------------------------------+
                                     |
                                     v
+------------------------------------+----------------------------------------------------+
|                             EVENT INGESTION & NORMALIZATION                             |
|  - Event-driven ingestion pipeline (Webhook / EventBridge / Pub-Sub)                    |
|  - JSON payload normalization to standard schema                                        |
+------------------------------------+----------------------------------------------------+
                                     |
                                     v
+------------------------------------+----------------------------------------------------+
|                                CLOUDATLER AI ENGINE                                     |
|  - Vector Embeddings Generation (Semantic Representation of Alert Context)               |
|  - Graph-Based Topology Correlation (Mapping dependencies across AWS/Azure/GCP/OCI)      |
|  - Intent & Severity Classification (Zero-shot classification & LLM-based analysis)      |
+------------------------------------+----------------------------------------------------+
                                     |
                                     +--------------------------+
                                     |                          |
                                     v                          v
                     +---------------+---------------+  +---------------+---------------+
                     |  INTELLIGENT ROUTING ENGINE   |  |   AUTOMATED REMEDIATION RUN   |
                     |  - Multi-dimensional scoring  |  |  - Safe rollbacks execution   |
                     |  - Dynamic team assignment    |  |  - Infrastructure-as-Code patch|
                     |  - ITSM Integration (Jira/SN) |  |  - Verification loops         |
                     +-------------------------------+  +-------------------------------+
1. Ingestion and Normalization
The first layer of the architecture is an ingestion engine designed to handle high-concurrency event streams. Telemetry data from multiple clouds is normalized into a standard schema. This schema captures the timestamp, resource identifiers (such as Amazon Resource Names or Azure Resource IDs), metric values, error logs, and associated metadata tags.
2. Vector Embeddings and Semantic Search
Once normalized, the unstructured text within the alert (e.g., stack traces, error messages, log snippets) is processed using a Natural Language Processing (NLP) pipeline. The system generates high-dimensional vector embeddings of the incident description. These embeddings are compared against a vector database of historical incidents, post-mortems, and runbooks. By calculating the cosine similarity between the current incident embedding and historical data, the Atler AI engine can immediately identify if a similar issue has occurred in the past, how it was resolved, and which team successfully resolved it.
3. Graph-Based Topology Correlation
AI routing cannot rely on text alone; it must understand the physical and logical relationships between resources. The routing engine maintains a real-time, multi-cloud dependency graph. If a network latency alert is triggered on a virtual private cloud (VPC) peering connection, and a database connection timeout alert is simultaneously triggered on an application container, the graph-based correlation engine groups these alerts into a single parent incident. This prevents the generation of duplicate tickets and ensures the root cause is addressed rather than the symptoms.
4. Multi-Dimensional Routing Score
Rather than relying on static assignment tables, the routing engine calculates a dynamic routing score for each candidate engineering group. This score is based on several variables:
Historical Resolution Efficiency: How quickly and successfully the team has resolved similar incidents in the past.
Current Operational Load: The number of active, high-priority tickets currently assigned to the team.
Resource Ownership: Metadata parsed from cloud configurations, mapping resource tags to specific cost centers or engineering units.
Bridging the Divide: Unifying FinOps and Security in Incident Management
Modern cloud operations cannot exist in a vacuum. Every operational incident has downstream financial and security implications. Traditional routing engines treat a misconfigured resource purely as an operational availability issue. An intelligent, unified platform recognizes that operational health, financial efficiency, and security posture are deeply intertwined.
Consider a scenario where an automated scaling group (ASG) in AWS experiences an application loop, causing it to scale out to its maximum limit of high-compute instances. A standard ITSM tool would route this to the application team as a performance warning. However, from a FinOps perspective, this runaway scaling event represents a massive spike in unbudgeted spend. From a security perspective, it could indicate a Distributed Denial of Service (DDoS) attack or an active exploit attempting to exhaust system resources.
By implementing unified cloud security management alongside operational intelligence, the routing engine can elevate the priority of the incident. It enriches the ticket with critical context: the projected financial impact of the runaway resource over the next 24 hours, and the security compliance frameworks (e.g., PCI-DSS, SOC 2) currently violated by the active configuration. The incident is simultaneously routed to the SRE and infrastructure engineering teams for performance tuning, and to the FinOps team to authorize immediate cost-containment measures.
Furthermore, when vulnerabilities are detected—such as an outdated OS package on a fleet of virtual machines—the system does not merely alert. It leverages automated patch remediation to schedule and execute updates during non-disruptive maintenance windows, calculating the financial cost of the patch execution versus the risk mitigation value in real time.
Automated Incident Remediation Workflows
Routing a ticket to the correct engineer is only half the battle. The ultimate goal of an intelligent cloud operations platform is to eliminate human intervention entirely for well-defined, repetitive incidents. Automated incident remediation utilizes event-driven runbooks to safely return infrastructure to a desired, secure, and cost-effective state.
The Anatomy of an Automated Remediation Loop
An automated remediation workflow must follow a strict, deterministic lifecycle to prevent runaway automation from destabilizing production environments. This lifecycle consists of four key phases:
Detection and Context Gathering: The system detects an anomaly (e.g., an S3 bucket configured with public read access, violating corporate security policies). The AI engine gathers metadata, including who created the resource, what applications read from it, and whether it contains sensitive data.
Policy Evaluation and Guardrail Check: Before executing any corrective action, the engine checks the proposed remediation against active organizational guardrails. For example, if the remediation is to restrict the bucket's access policy, the engine verifies that this action will not break active production workloads identified in the dependency graph.
Execution of Remediation: The platform executes the remediation via secure, native cloud APIs or by triggering an Infrastructure-as-Code (IaC) pipeline run (e.g., running a Terraform cloud workspace to reconcile state). In our S3 example, the bucket policy is updated to block public access, and default server-side encryption is enforced.
Verification and Feedback Loop: The platform monitors the resource for a specified period to ensure the anomaly is resolved and that no secondary failures occur. If the verification step fails, the system executes a safe rollback to the previous known-good state and flags the incident for manual human intervention.
Remediation Blueprint: Mitigating Memory Leaks on Virtual Machine Scales
Let's examine a concrete operational scenario: a cluster of Azure Virtual Machines running a legacy application experiences a gradual memory leak, eventually leading to Out-Of-Memory (OOM) crashes. Below is an example of a structured, automated remediation policy payload that an AI-driven platform executes to resolve the issue without manual intervention:
{
  "remediationPolicy": {
    "policyId": "pol-rem-09283",
    "targetCloud": "Azure",
    "triggerMetric": "vm.memory.utilization",
    "threshold": 95.0,
    "durationMinutes": 15,
    "actions": [
      {
        "step": 1,
        "actionType": "CollectDiagnostics",
        "parameters": {
          "dumpPath": "/var/log/diagnostics/mem_dump.bin",
          "compress": true
        }
      },
      {
        "step": 2,
        "actionType": "GracefulRestart",
        "parameters": {
          "drainTimeoutSeconds": 300,
          "rollingUpdate": true,
          "maxUnavailablePercentage": 25
        }
      },
      {
        "step": 3,
        "actionType": "VerifyHealth",
        "parameters": {
          "healthEndpoint": "https://app.internal/healthz",
          "expectedStatus": 200,
          "retryCount": 5,
          "retryIntervalSeconds": 30
        }
      }
    ],
    "rollback": {
      "onFailure": "RevertToBackupImage",
      "notifyChannel": "#sre-alerts-critical"
    }
  }
}
This policy details how the system first captures diagnostics (preventing the loss of critical debugging data), performs a rolling restart to maintain application availability, verifies health, and contains an explicit rollback instruction should the application fail to recover.
Step-by-Step Implementation Guide to AI-Driven Operations
Transitioning to an AI-driven ticketing and remediation model requires a structured, phased approach. Organizations cannot jump from manual ticketing to fully autonomous self-healing overnight. The following four-step framework outlines a path to implementation.
Step 1: Establish High-Fidelity Data Ingestion
Begin by centralizing all log, metric, and event streams across your multi-cloud environments. Ensure that your resources are tagged consistently. If your tagging hygiene is poor, implement automated tagging policies to retroactively apply cost-center, owner, and environment tags. This foundation of clean data is critical for training machine learning models and establishing reliable topological graphs.
Step 2: Implement Shadow Routing
Deploy your AI routing engine in "shadow mode." Allow the AI models to analyze incoming incidents and predict the optimal routing path and assigned team, but do not allow it to modify tickets in your production ITSM platform. Compare the AI's predictions against the manual routing decisions made by your service desk. Refine the models until the classification accuracy exceeds 90% before enabling active, automated routing.
Step 3: Automate Low-Risk, High-Frequency Incidents
Identify the top five most frequent, low-risk incidents in your queue—such as disk space exhaustion, expired SSL certificates, or non-compliant security group rules. Author automated remediation runbooks for these specific scenarios. Ensure that each runbook has strict guardrails, explicit approval steps (if required by your change advisory board), and verified rollback paths.
Step 4: Close the Loop with Continuous Learning
As your automated remediation runbooks execute, feed the outcome data back into the AI engine. If a remediation successfully resolves an issue, the model reinforces that resolution path. If a runbook fails or requires manual rollback, the system automatically flags the failure, analyzes the telemetry anomalies that occurred during execution, and prompts engineers to update the underlying runbook logic.
Metrics that Matter: The ROI of AI-Powered Operations
To justify the transition to AI-driven operations, technology leaders must track specific, quantifiable metrics that demonstrate impact across operational efficiency, security risk mitigation, and financial optimization.
Operational Metric | Manual Operations Baseline | Rule-Based Automation | CloudAtler AI-Driven Operations |
|---|---|---|---|
Mean Time to Acknowledge (MTTA) | 2 - 4 Hours | 15 - 30 Minutes | < 30 Seconds |
Mean Time to Resolution (MTTR) | 12 - 24 Hours | 2 - 4 Hours | < 5 Minutes (Automated) |
Ticket Routing Accuracy | 65% - 75% | 80% (Highly rigid) | > 97% (Dynamic & contextual) |
Operational Cost (FTE Overhead) | High (Requires dedicated L1/L2 triage) | Medium (Constant rule maintenance) | Low (Self-optimizing models) |
FinOps Waste Containment | Reactive (Discovered during monthly billing) | Partial (Static threshold alerts) | Proactive (Real-time runaway cost mitigation) |
By measuring these metrics pre- and post-implementation, organizations typically observe a dramatic reduction in operational overhead. SRE teams are freed from manual triage and repetitive firefighting, allowing them to focus on high-value engineering efforts, such as improving application architecture and designing resilient distributed systems.
Conclusion & Call to Action
The scale and velocity of modern multi-cloud environments have outpaced the capabilities of manual incident response. Relying on legacy ticketing workflows and static routing rules introduces latency, increases the risk of security breaches, and leads to unmanaged cloud spend. By integrating AI-driven ticket routing with automated incident remediation, enterprises can achieve a self-healing, highly secure, and financially optimized cloud infrastructure.
Ready to transform your cloud operations? Don't let operational complexity drain your engineering resources and inflate your cloud budget. Unify your FinOps, security, and automated operations into a single pane of glass. Learn how our platform can revolutionize your multi-cloud environment—visit CloudAtler today and schedule a personalized demo with our engineering team.
All in One Place
Atler Pilot decodes your cloud spend story by bringing monitoring, automation, and intelligent insights together for faster and better cloud operations.