
The Needle in the Microservice Haystack
In a monolithic application, debugging is relatively straightforward. If the application crashes, you log into the single server, open the single log file, and find the stack trace.
Modern cloud architectures have shattered the monolith into hundreds of ephemeral, distributed microservices. A single user request (e.g., clicking "Checkout") might trigger 40 different internal API calls across AWS Lambda functions, EKS containers, and Kafka event streams. If that checkout request takes 5 seconds instead of 500 milliseconds, finding the bottleneck is like finding a needle in a massive, constantly shifting haystack. This is why basic monitoring is dead, and Cloud Observability is mandatory.
Monitoring vs. Observability
These terms are often conflated, but they describe different postures.
Monitoring (Reactive): Tells you that a system is broken. It relies on pre-defined dashboards. (e.g., CPU utilization hits 90%, send a pager alert). Monitoring answers: "Is the system working?"
Observability (Proactive): Tells you why the system is broken. It allows you to ask arbitrary questions about your system's behavior that you didn't know you needed to ask before the outage occurred. Observability answers: "Why is this specific user experiencing latency only when checking out with a specific credit card type?"
The Three Pillars: Metrics, Logs, and Traces
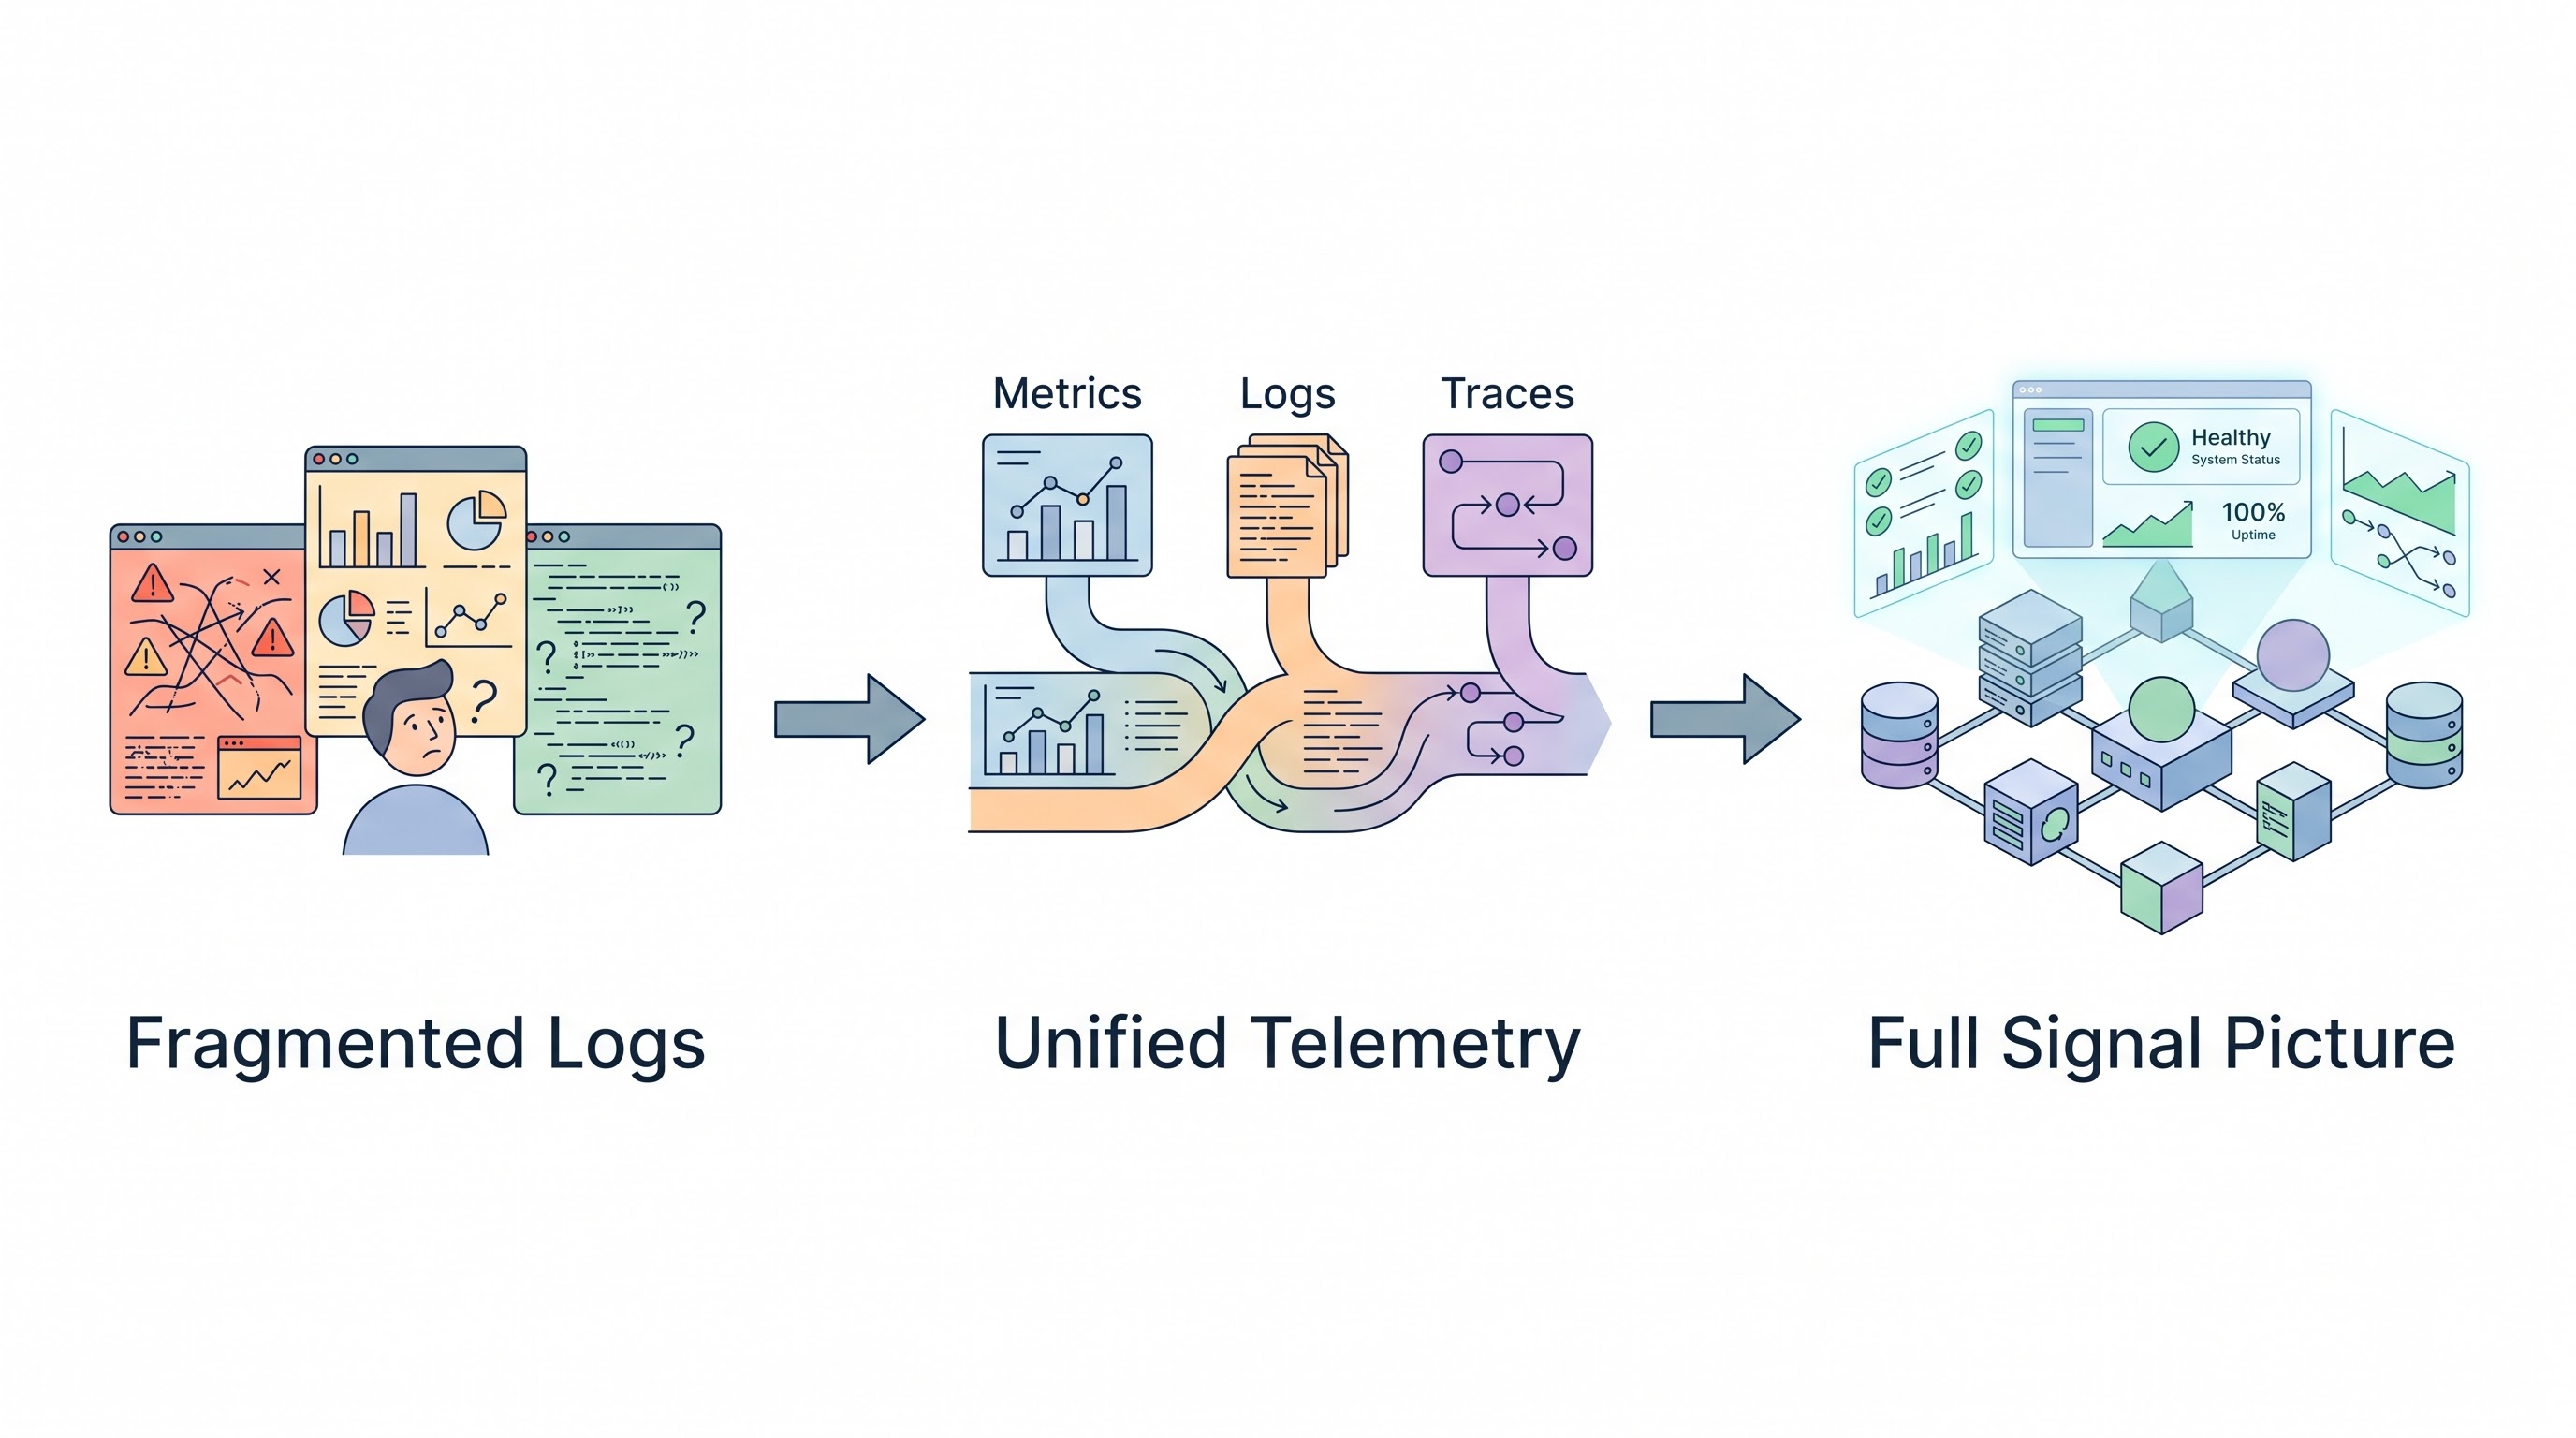
True observability requires the seamless integration of three distinct data types (often referred to as MELT, adding 'Events'):
Metrics: The high-level numbers (CPU usage, network throughput, error rate). They are cheap to store and excellent for triggering alerts.
Logs: The highly detailed, timestamped records of discrete events (e.g., "Database connection failed"). They are expensive to store but essential for deep debugging.
Traces: The crucial missing link for microservices. Traces track a single request as it propagates across every boundary in the system.
The Power of Distributed Tracing
Without distributed tracing (e.g., OpenTelemetry, AWS X-Ray), debugging a microservice architecture is impossible.
When a request enters the API Gateway, a unique "Trace ID" is attached to it. As the request moves from the Auth Service to the Inventory Service to the Payment Gateway, that Trace ID is passed along. If the request fails, the SRE team can pull up that single Trace ID in their observability platform. They see a visual waterfall chart of the entire journey, instantly identifying exactly which specific microservice down the chain caused the 4-second delay.
The High Cardinality Problem
To ask arbitrary questions (Observability), you must tag your metrics with rich context (e.g., customer_id, payment_tier, region). This creates "High Cardinality" data.
Legacy monitoring tools choke on high cardinality data. If you try to group latency metrics by 1 million unique customer_ids, the database crashes. Modern observability platforms (like Honeycomb or Datadog) are built on columnar data stores specifically designed to ingest and query massive, high-cardinality datasets in milliseconds, allowing engineers to instantly slice data to find the one specific user experiencing the bug.
The Cost of Observability (FinOps)
The dark side of observability is the bill. Ingesting, indexing, and storing terabytes of logs and traces is incredibly expensive. In some organizations, the Datadog bill eclipses the AWS compute bill.
Applying FinOps to observability is critical. Organizations must implement aggressive sampling strategies. Instead of keeping 100% of all distributed traces, the system should only retain 1% of successful traces, but retain 100% of the traces that result in errors or high latency. Furthermore, use "log routing" to send low-value logs directly to cheap S3 Glacier storage rather than paying a premium to index them in the primary observability platform.
Key Takeaway
Basic monitoring is insufficient for modern microservices. Cloud Observability requires integrating Metrics, Logs, and Distributed Traces into a single, high-cardinality platform, allowing SREs to ask arbitrary questions to identify the root cause of complex failures. However, organizations must implement strict data sampling and log routing strategies to ensure the cost of observability does not exceed the value it provides.
All in One Place
Atler Pilot decodes your cloud spend story by bringing monitoring, automation, and intelligent insights together for faster and better cloud operations.