
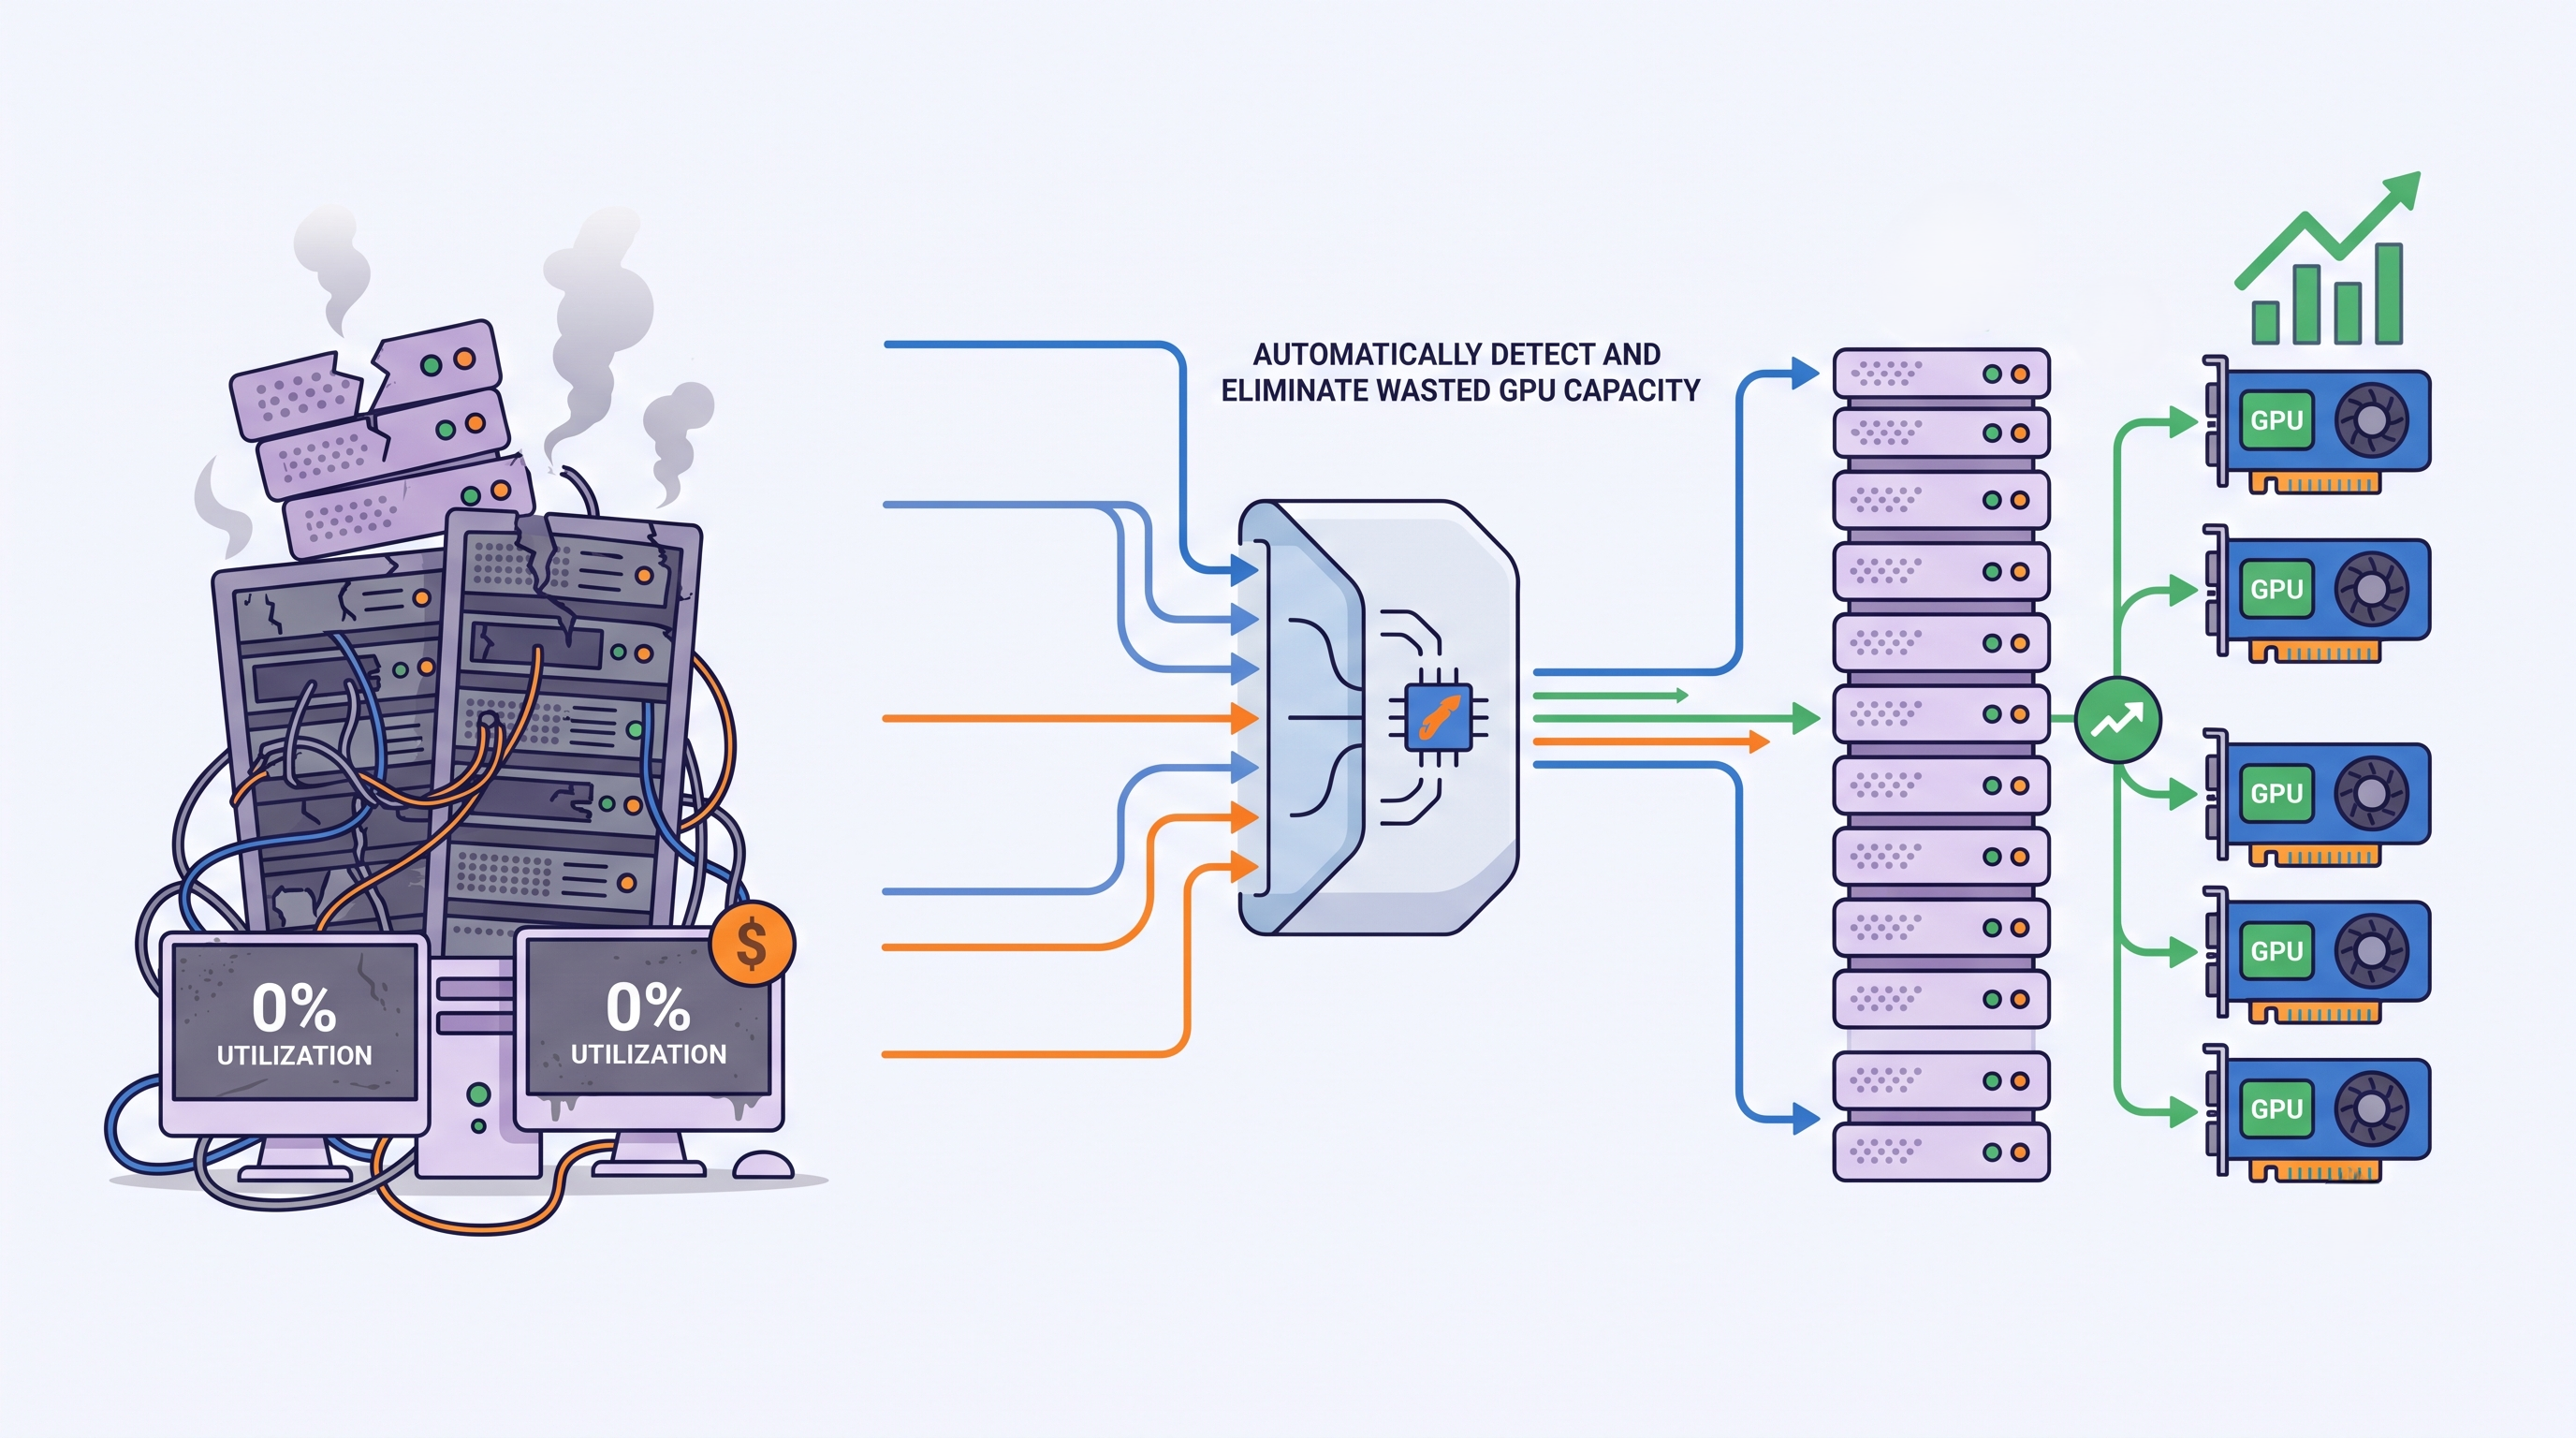
GPU clusters have quickly become one of the most valuable and expensive resources in modern cloud environments.
Whether you're training large language models, fine-tuning foundation models, running inference pipelines, or powering AI agents, GPUs are at the heart of today's AI infrastructure. They deliver the compute needed for complex workloads that CPUs simply can't handle efficiently.
But there's a catch.
Unlike traditional compute resources, GPUs come with a premium price tag. A single high-end GPU instance can cost several times more than a standard virtual machine, and large AI teams often provision entire GPU clusters to support experimentation, model training, batch processing, and production inference.
That investment makes sense when GPUs are actively working.
It becomes a problem when they aren't.
Across many organizations, GPU clusters remain provisioned long after workloads have finished. Development environments stay online overnight, abandoned experiments continue consuming resources, inference services remain overprovisioned during low-traffic periods, and Kubernetes clusters reserve GPUs that applications never actually use.
The result is surprisingly common: organizations pay for GPU capacity that delivers little or no business value.
For AI teams, the challenge isn't simply identifying expensive infrastructure. It's understanding whether that infrastructure is actually being utilized.
This is why detecting idle GPU clusters has become a critical part of modern AI FinOps and cloud cost optimization. Rather than waiting for monthly cloud invoices to reveal wasted spending, engineering teams are increasingly using automation to identify underutilized GPU resources as they occur.
In this guide, we'll explore why idle GPU clusters are so difficult to spot, which utilization signals matter most, and how engineering teams can automatically detect and eliminate wasted GPU capacity before it turns into unnecessary cloud costs.
Why Idle GPU Clusters are Becoming a Cost Problem
As AI adoption accelerates, organizations are provisioning GPU infrastructure faster than ever before.
Data scientists need environments for experimentation. Machine learning engineers require dedicated resources for model training. Platform teams maintain shared Kubernetes clusters, while product teams deploy inference services to support AI-powered applications.
Each new initiative introduces additional GPU capacity.
The problem is that GPU allocation is often much easier than GPU deallocation.
A team might provision a cluster for a three-day training job and forget to shut it down after the model finishes. Another team may reserve eight GPUs for a project that only ever uses two. An inference service designed for peak demand may continue running at full capacity overnight when user traffic drops significantly.
None of these situations are caused by poor engineering practices. They are a natural consequence of managing dynamic AI infrastructure at scale.
The larger an AI environment becomes, the more difficult it is to manually determine which GPU clusters are actively delivering value and which are simply waiting for work.
Without continuous visibility, idle infrastructure quietly becomes one of the biggest sources of cloud waste.
What Does an Idle GPU Cluster Actually Mean?
When people hear the term idle GPU cluster, they often imagine hardware that's completely switched on but doing absolutely nothing.
In reality, idle infrastructure is much more nuanced.
A GPU cluster may appear healthy because Kubernetes nodes are running, workloads are scheduled, and monitoring dashboards show active pods. Yet the GPUs themselves may spend most of their time waiting rather than processing meaningful work.
An AI training cluster that completed its workload yesterday but remains online is idle.
An inference deployment running twenty-four hours a day while serving only a handful of requests overnight is partially idle.
A Kubernetes cluster with GPU-enabled nodes reserved for applications that never request GPU resources is also effectively idle.
In other words, idle doesn't necessarily mean inactive. It means expensive infrastructure is consuming resources without generating proportional business value.
Recognizing this distinction is essential because many traditional infrastructure monitoring tools focus on system health rather than resource efficiency.
A cluster can be perfectly healthy while simultaneously wasting thousands of rupees every day.
Why Manual Monitoring Doesn't Scale
During the early stages of AI adoption, engineering teams could often identify unused GPU resources simply by reviewing dashboards or checking cloud provider consoles.
That approach quickly breaks down as environments grow.
Modern AI platforms may include multiple Kubernetes clusters, hundreds of GPU-enabled nodes, dozens of machine learning projects, shared development environments, and production inference services spread across multiple cloud regions.
Keeping track of utilization manually becomes nearly impossible.
Even if an operations engineer reviews utilization metrics every morning, an idle cluster created just a few hours later may remain unnoticed for days.
By the time someone discovers it, the organization has already incurred unnecessary cloud costs.
Manual monitoring also struggles to identify patterns.
A GPU cluster that remains underutilized every weekend or during specific business hours may not stand out in occasional reviews, but automation can detect those recurring trends immediately.
This is why leading AI organizations are moving away from periodic infrastructure reviews toward continuous, automated GPU utilization monitoring.
The Metrics That Actually Reveal Idle GPU Clusters
Detecting idle GPU clusters requires more than checking whether a cluster is running.
Engineering teams need to understand how effectively GPU resources are being used over time.
One of the most important indicators is GPU utilization. If GPUs consistently remain at very low utilization despite being allocated, it's a strong signal that the infrastructure is oversized or no longer required.
Another important metric is GPU memory utilization. Applications sometimes reserve GPU memory without performing meaningful computation. Monitoring memory consumption alongside processing activity helps distinguish between active workloads and resources that are merely reserved.
Power consumption can also provide valuable insight. GPUs drawing minimal power for extended periods often indicate workloads are inactive or waiting for input rather than executing compute-intensive tasks.
Within Kubernetes environments, resource requests and scheduling behaviour are equally important. GPU-enabled nodes may remain allocated even though no pods actively require GPU resources. Examining how GPUs are requested, reserved, and consumed across namespaces often reveals hidden inefficiencies that basic infrastructure monitoring misses.
Rather than relying on a single metric, mature organizations correlate utilization, memory usage, workload scheduling, runtime behaviour, and historical activity to build a much more accurate picture of GPU efficiency.
Why Utilization Alone Isn't Enough
Although GPU utilization is one of the most important indicators, it should never be viewed in isolation.
Imagine a model training job that pauses while waiting for data to be loaded from storage.
GPU utilization temporarily drops close to zero.
An automated system looking only at utilization might incorrectly classify the cluster as idle and recommend shutting it down.
Now consider another inference service showing moderate GPU utilization throughout the day.
At first glance, everything appears normal.
However, traffic analysis reveals that the service receives almost no user requests for eighteen hours every day because it was provisioned for peak demand rather than average demand.
From an infrastructure perspective, the cluster appears active.
From a business perspective, it is significantly overprovisioned.
This illustrates why accurate idle GPU detection requires context rather than individual metrics.
Understanding workload schedules, application behaviour, business demand, and historical utilization patterns allows engineering teams to distinguish temporary inactivity from genuine resource waste.
Building an Automated Detection Strategy
The most effective approach to identifying idle GPU clusters is to move beyond simple threshold-based alerts.
Instead of generating notifications whenever GPU utilization falls below a fixed percentage, organizations should build automated detection strategies that evaluate infrastructure over time.
For example, a cluster that remains below a defined utilization threshold for several consecutive hours while receiving minimal workload activity may deserve investigation. Similarly, GPU nodes that remain allocated without serving active AI workloads for extended periods can be flagged automatically for review.
Historical trend analysis adds another layer of intelligence. By comparing current utilization with previous usage patterns, engineering teams can identify clusters that have gradually become underutilized following changes in application architecture, deployment frequency, or business demand.
Rather than reacting to isolated metrics, automation creates a continuous feedback loop that helps organizations identify idle infrastructure before unnecessary costs accumulate.
Automating Idle GPU Cluster Detection
Detecting idle GPU clusters isn't just about collecting metrics. It's about turning those metrics into actionable decisions.
As AI infrastructure grows, manually reviewing dashboards or reacting to alerts becomes increasingly impractical. Engineering teams need systems that continuously evaluate GPU utilization, correlate infrastructure activity with workload behavior, and notify operators before idle resources become a significant financial burden.
A modern detection workflow typically begins with continuous telemetry collection. GPU utilization, memory usage, power consumption, node health, Kubernetes scheduling activity, and application-level metrics are gathered from across the AI infrastructure. Rather than evaluating these metrics independently, they are analyzed together to determine whether a cluster is actively delivering value or simply consuming expensive compute resources.
The next step is context-aware analysis.
Instead of asking, "Is GPU utilization below 20% right now?", automated systems ask broader questions.
Has utilization remained consistently low for several hours?
Is there an active training job scheduled?
Are inference requests actually reaching the application?
Have GPU-enabled nodes been reserved without serving AI workloads?
Looking at infrastructure through this wider operational lens significantly reduces false positives and helps engineering teams focus on clusters that genuinely require attention.
Kubernetes Plays a Critical Role
Many enterprise AI workloads now run on Kubernetes because it simplifies orchestration, improves scalability, and allows GPU resources to be shared across multiple teams.
However, Kubernetes can also make idle infrastructure harder to identify.
A Kubernetes cluster may appear healthy because nodes are available, pods are running, and workloads are successfully scheduled. Yet those workloads may barely utilize the GPUs assigned to them.
This is particularly common when resource requests are larger than actual application requirements.
For example, a machine learning team might reserve eight GPUs for experimentation, anticipating future scaling. Weeks later, the application may still be using only two GPUs while the remaining six remain unavailable to other teams.
Without visibility into both Kubernetes scheduling and GPU utilization, these inefficiencies often go unnoticed.
By correlating namespace activity, pod scheduling, node allocation, and GPU performance, organizations can identify situations where allocated resources far exceed actual demand.
Moving Beyond Threshold-Based Alerts
Traditional monitoring platforms rely heavily on static thresholds.
If GPU utilization falls below a predefined value, an alert is triggered.
While this approach works for some infrastructure metrics, it performs poorly in AI environments.
Machine learning workloads are rarely consistent.
Training jobs frequently pause while loading datasets.
Inference services experience fluctuating traffic throughout the day.
Batch processing pipelines often remain inactive until scheduled execution windows.
If every temporary drop in utilization generated an alert, operations teams would quickly experience alert fatigue.
Modern AI observability platforms instead focus on behavioral patterns.
Rather than reacting to a single moment in time, they evaluate utilization trends over extended periods, compare current behavior with historical baselines, and identify meaningful deviations that warrant investigation.
This approach produces far more reliable recommendations while minimizing unnecessary operational noise.
Why do Historical Trends Matter?
A snapshot of GPU utilization tells you what is happening right now.
Historical analysis explains why it is happening.
Suppose an AI inference cluster consistently maintains 70% GPU utilization during weekdays but falls below 10% every weekend.
That isn't necessarily a problem.
It may simply reflect predictable business demand.
Now imagine another cluster that maintained high utilization for months before dropping to nearly zero immediately after a model migration.
Historical trends reveal that something has fundamentally changed.
Perhaps applications were moved to another cluster.
Perhaps the project was completed.
Or perhaps the workload failed silently and no one noticed.
Without historical visibility, these patterns are easy to overlook.
Trend analysis transforms isolated utilization metrics into meaningful operational insights, helping teams distinguish temporary inactivity from long-term resource waste.
AI Can Improve Idle Resource Detection
Artificial intelligence isn't only transforming business applications.
It is also changing how infrastructure itself is managed.
Modern observability platforms increasingly apply machine learning techniques to identify unusual resource behavior.
Instead of relying on manually configured rules, these systems learn normal utilization patterns and automatically detect anomalies.
For example, they can recognize when:
GPU utilization suddenly declines after a software release.
Training jobs consistently reserve more GPUs than they consume.
Specific teams repeatedly leave development clusters running overnight.
Certain inference services remain overprovisioned despite declining traffic.
Because these recommendations are based on long-term behavior rather than fixed thresholds, engineering teams receive insights that are more accurate and easier to prioritize.
The result is a more proactive approach to AI infrastructure optimization.
Common Mistakes That Keep GPU Clusters Idle
Many organizations invest heavily in high-performance GPU infrastructure but overlook the operational practices needed to use it efficiently.
One of the most common mistakes is assuming that provisioning resources is the final step in the process. In reality, continuous monitoring is just as important.
Another frequent issue is treating all GPU workloads the same. Training jobs, experimentation environments, production inference services, and development clusters each have different utilization patterns. Applying identical monitoring rules across every workload often produces misleading conclusions.
Organizations also struggle with poor resource allocation practices. GPU reservations are frequently based on expected future demand rather than actual usage. While this approach simplifies deployment, it often leaves valuable compute capacity sitting idle for extended periods.
Finally, many teams monitor infrastructure health without monitoring infrastructure efficiency.
A healthy cluster isn't necessarily an efficient cluster.
Keeping workloads online without understanding whether they are delivering value can quietly become one of the largest contributors to AI cloud spending.
Detecting Idle GPU Clusters is Only the Beginning
Finding idle infrastructure is valuable, but identifying the problem is only the first step.
The real objective is building an operational process that continuously improves GPU efficiency.
Once idle clusters are detected, engineering teams should evaluate whether workloads can be consolidated, infrastructure can be rightsized, autoscaling policies can be adjusted, or unused environments can be automatically decommissioned.
These decisions become significantly easier when GPU utilization is viewed alongside workload ownership, business context, deployment history, and cloud cost data.
Rather than optimizing individual clusters, organizations begin optimizing their entire AI infrastructure lifecycle.
Optimize GPU Utilization with Atler Pilot
Managing GPU infrastructure at scale requires more than isolated utilization metrics.
Engineering teams need to understand how Kubernetes workloads, AI training pipelines, inference services, cloud resources, and GPU utilization interact across the entire environment.
Atler Pilot provides that broader perspective by combining infrastructure telemetry, workload intelligence, utilization analytics, cloud cost visibility, and operational context into a unified platform.
Instead of simply reporting low GPU utilization, Atler Pilot helps engineering, platform, DevOps, and FinOps teams identify why clusters become idle, which workloads are responsible, how utilization changes over time, and where optimization opportunities exist.
By correlating GPU performance with Kubernetes activity, AI workloads, cloud infrastructure, and operational behavior, teams can reduce idle capacity, improve resource efficiency, and make better-informed decisions about AI infrastructure investments.
The result isn't just lower cloud costs.
It's an AI platform where expensive GPU resources are consistently aligned with meaningful business demand.
Conclusion
GPU infrastructure has become one of the most strategic assets in modern cloud environments, powering everything from foundation model training to real-time AI inference.
It has also become one of the largest contributors to cloud spending.
As organizations scale their AI initiatives, manually identifying underutilized GPU clusters is no longer realistic. Dynamic workloads, Kubernetes orchestration, shared infrastructure, and constantly changing business demand make traditional monitoring approaches increasingly ineffective.
Automatically detecting idle GPU clusters allows engineering teams to move from reactive cost management to proactive infrastructure optimization.
By combining GPU utilization metrics with Kubernetes telemetry, workload context, historical trends, and intelligent analysis, organizations can identify expensive resources that are no longer delivering value and act before unnecessary costs accumulate.
Ultimately, optimizing GPU infrastructure isn't about keeping utilization at one hundred percent.
It's about ensuring every GPU that remains online has a clear purpose, supports a meaningful workload, and contributes to measurable business outcomes.
Because in AI infrastructure, the most expensive GPU isn't the busiest one.
It's the one that's quietly waiting for work while the cloud bill continues to grow.
All in One Place
Atler Pilot decodes your cloud spend story by bringing monitoring, automation, and intelligent insights together for faster and better cloud operations.