
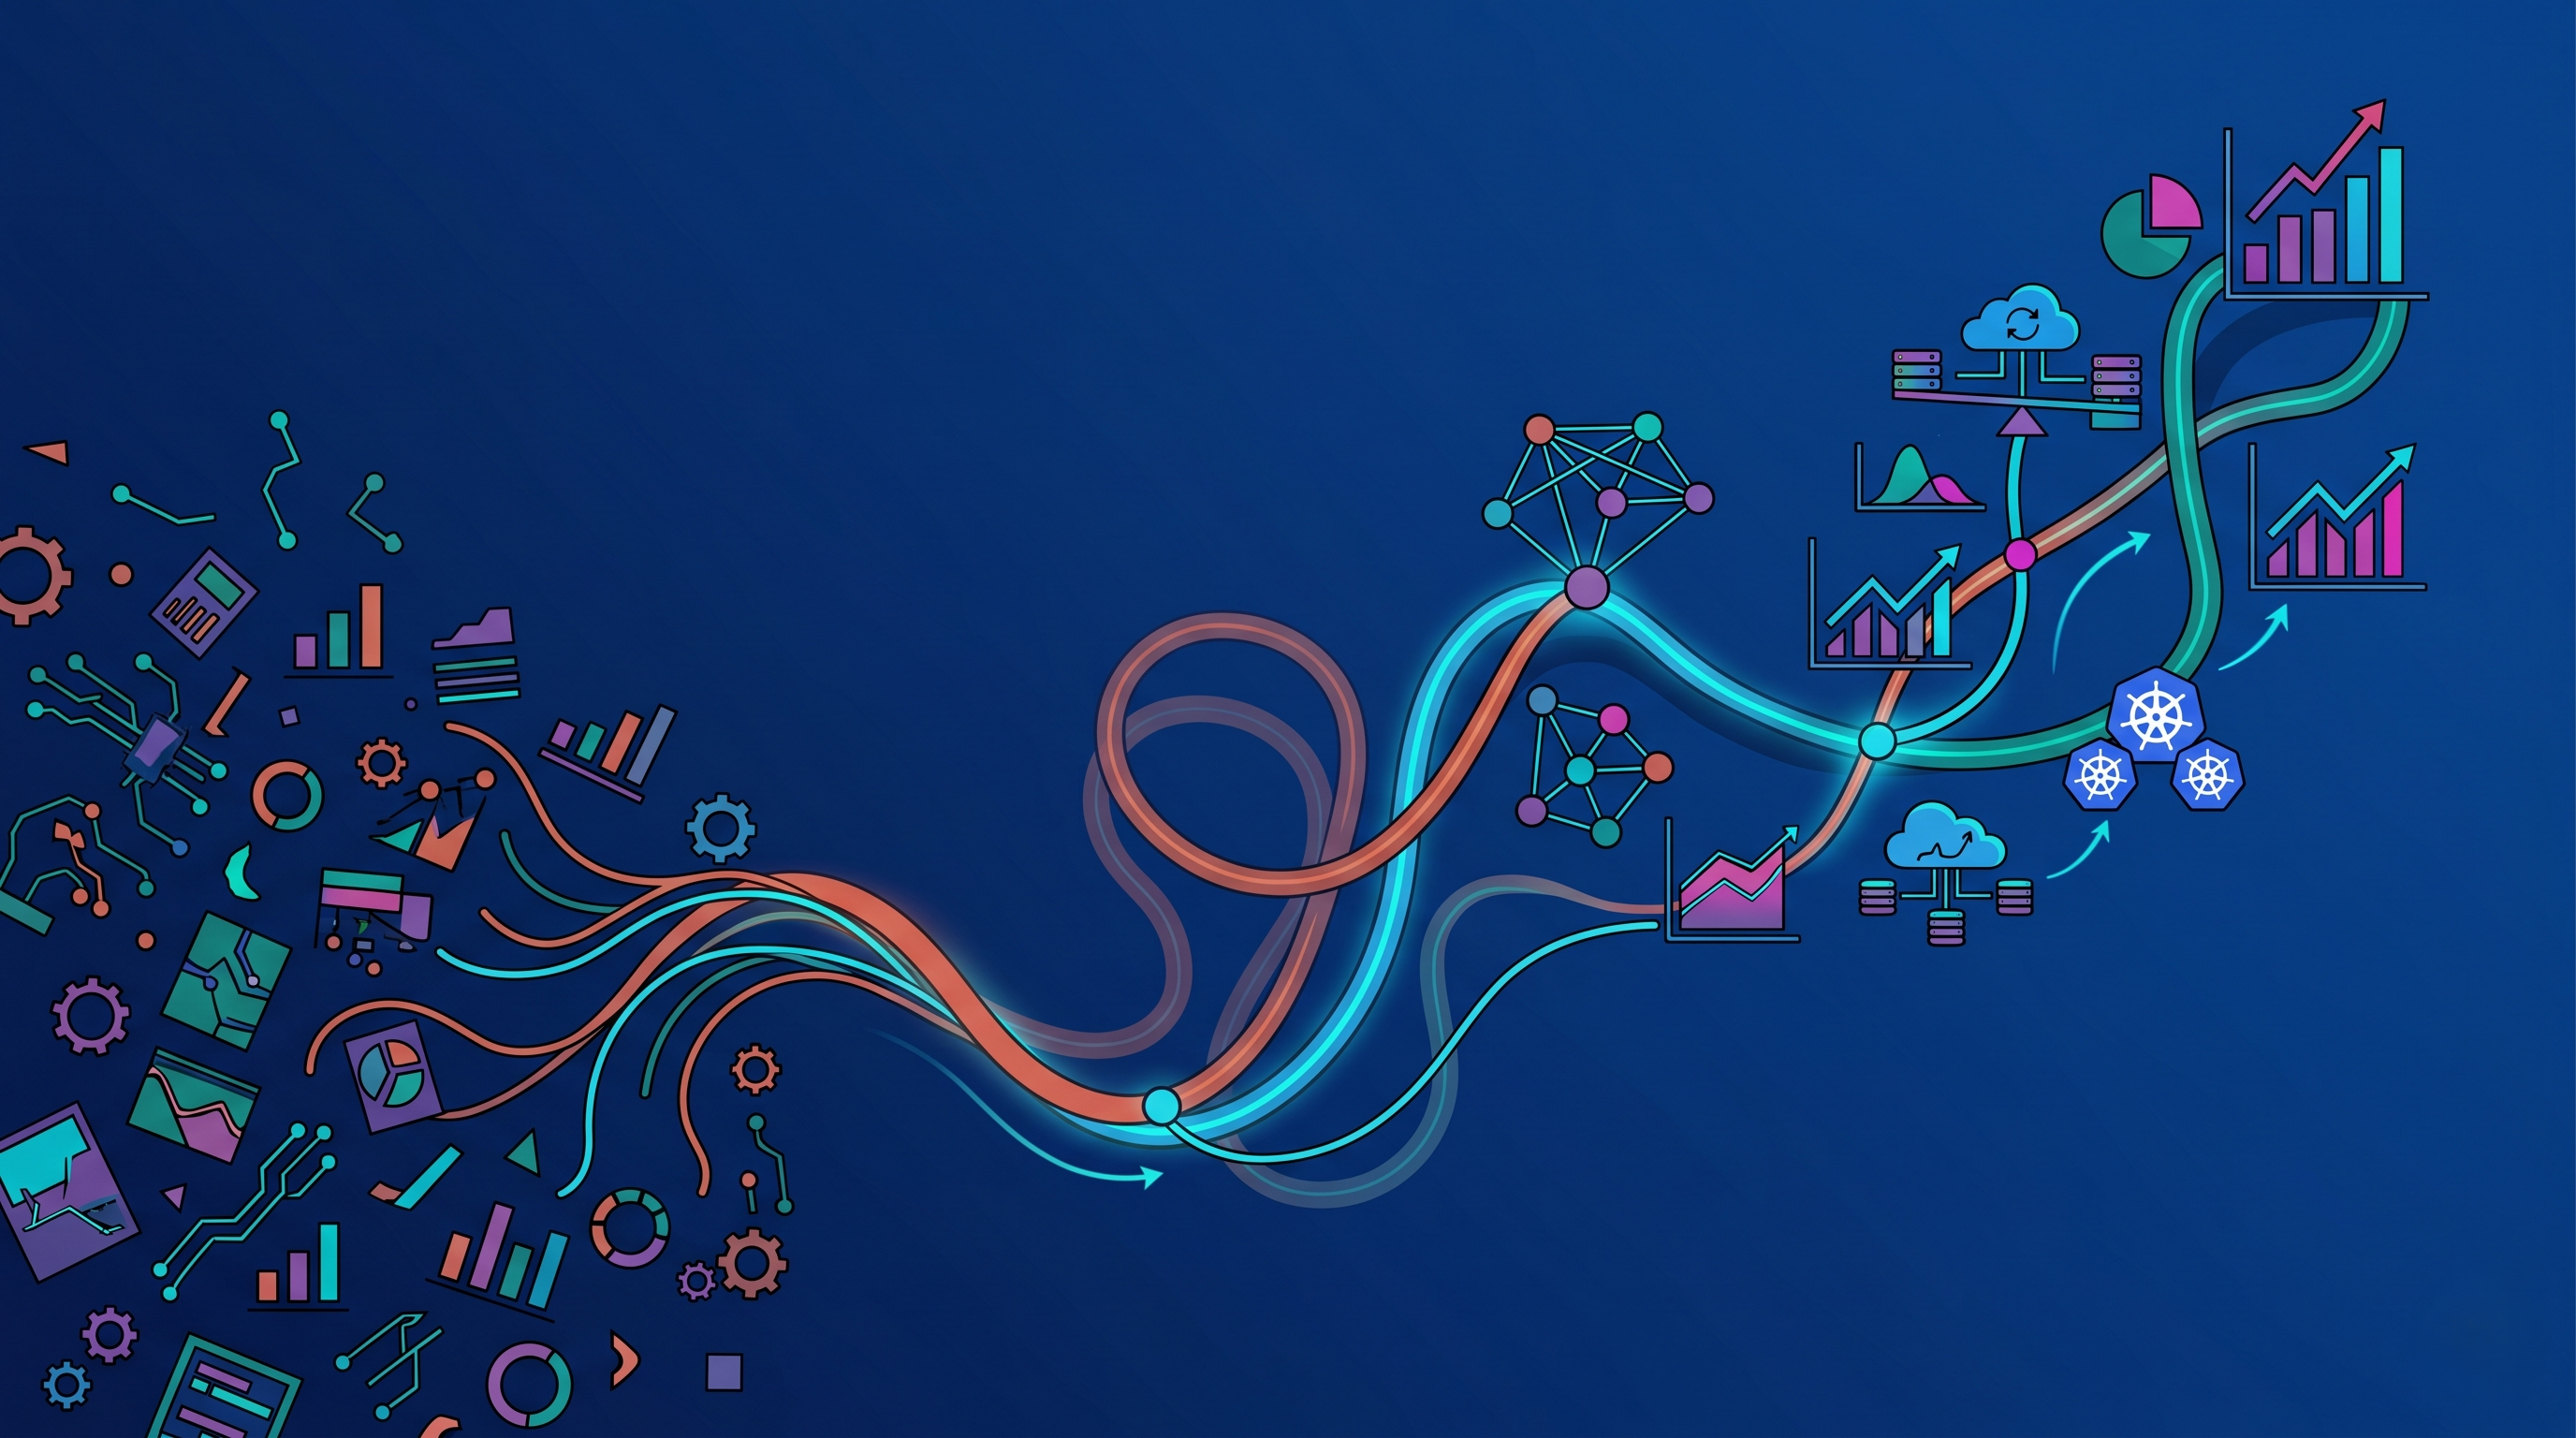
Modern cloud-native environments generate an extraordinary amount of telemetry. Every Kubernetes workload, application, database, API, AI service, storage platform, and infrastructure component continuously produces metrics, logs, traces, events, and operational signals.
Most organizations collect this data to improve visibility, detect incidents, troubleshoot issues, and monitor system health. Yet despite having more telemetry than ever before, many teams still struggle to answer a simple question: What is the infrastructure actually trying to tell us?
The challenge is that telemetry is often viewed as a collection of individual data points rather than as part of a larger story. Metrics show utilization, logs capture events, traces reveal request paths, and alerts highlight anomalies. But when these signals are examined independently, critical operational insights often remain hidden.
Beneath the dashboards, alerts, and monitoring systems lies a narrative about how infrastructure behaves, how workloads evolve, where inefficiencies emerge, and how risks develop over time.
Organizations that learn to uncover this narrative gain a significant advantage in reliability, scalability, cost optimization, and operational decision-making.
Let's get right into the blog and explore the infrastructure story hidden inside your telemetry.
Telemetry Captures More Than System Activity
Most teams view telemetry as a mechanism for measuring infrastructure performance.
Metrics report resource utilization, logs record operational events, traces reveal service interactions, and alerts identify conditions that require attention. These signals are often treated as operational outputs generated by infrastructure.
In reality, telemetry captures much more than activity alone.
Every signal reflects decisions being made throughout the environment. Resource allocation policies influence utilization metrics. Deployment strategies shape operational events. Autoscaling behavior affects infrastructure patterns. Application architectures influence dependency relationships.
Telemetry therefore becomes a reflection of how systems behave rather than simply what systems are doing.
The value lies not only in the data itself but in what that data reveals about the operational environment.
Every Metric Represents a Larger Story
A single metric rarely provides meaningful insight on its own.
For example, a CPU utilization increase might appear significant when viewed independently. However, its true meaning depends on workload demand, infrastructure allocation, application behavior, scaling activity, and historical trends.
The same principle applies to nearly every operational metric.
Memory consumption, latency, network traffic, storage growth, and resource utilization all represent chapters within a broader infrastructure narrative. Without context, teams see isolated measurements. With context, they begin to understand why systems behave the way they do.
The most valuable operational insights often emerge when multiple metrics are connected into a larger story rather than analyzed individually.
Kubernetes Telemetry Reveals Behavioral Patterns
Kubernetes environments generate enormous volumes of telemetry because of their dynamic nature.
Workloads scale automatically, pods move across nodes, resources are allocated continuously, and deployments occur frequently. Each of these activities produces signals that contribute to the operational story of the cluster.
Many teams focus primarily on real-time metrics such as node health, pod status, or resource utilization. While these indicators remain important, they often reveal only current conditions.
The deeper value lies in identifying patterns.
Telemetry can reveal how workloads consume resources over time, how autoscaling decisions influence efficiency, how scheduling behavior affects cluster utilization, and how infrastructure evolves as application demand changes.
These behavioral patterns often provide greater operational insight than any individual metric or alert.
Infrastructure Inefficiencies Leave Clues Everywhere
One of the most overlooked aspects of telemetry is its ability to expose inefficiencies.
Resource fragmentation, oversized workloads, idle infrastructure, excessive observability overhead, inefficient scaling policies, and architectural complexity all leave traces within operational data.
The challenge is that these clues rarely appear as obvious alerts.
Instead, they emerge through subtle patterns spread across multiple signals. Resource requests may consistently exceed actual utilization. Cluster capacity may grow despite stable demand. Storage consumption may increase faster than business activity.
Viewed individually, these signals may seem insignificant. Viewed collectively, they often tell a compelling story about how infrastructure efficiency is evolving.
Organizations that understand these narratives can identify optimization opportunities long before cloud costs or performance issues become visible.
AI Workloads Create New Telemetry Narratives
The rapid adoption of AI infrastructure is generating entirely new categories of telemetry.
GPU utilization, inference latency, vector database activity, model-serving performance, retrieval workflows, and AI observability systems all contribute to increasingly complex operational environments.
These signals often reveal patterns that differ significantly from traditional application workloads.
For example, telemetry may indicate that GPU resources are underutilized despite high infrastructure spending. Inference workloads may create scaling patterns that differ from conventional services. Vector databases may drive unexpected storage growth.
Understanding these narratives is becoming essential for organizations seeking to optimize AI infrastructure while maintaining performance and controlling costs.
As AI adoption grows, telemetry interpretation becomes just as important as telemetry collection.
Incident Signals Often Begin Long Before Incidents Occur
Many organizations use telemetry primarily for incident detection and troubleshooting.
While telemetry is extremely valuable during outages, its greatest potential may lie in identifying risks before incidents happen.
Infrastructure rarely fails without warning. Resource contention, dependency instability, scaling inefficiencies, workload imbalance, and architectural weaknesses often produce subtle signals long before customer impact occurs.
These early indicators are frequently visible within telemetry streams but remain unnoticed because teams focus primarily on current operational status.
By analyzing telemetry as an evolving narrative rather than a collection of isolated events, organizations can identify emerging risks earlier and reduce reliance on reactive incident response.
Telemetry Reveals How Architecture Evolves
Architecture diagrams provide a planned view of how systems are supposed to operate.
Telemetry reveals how they actually operate.
As applications evolve, new dependencies emerge, services interact differently, workloads move across environments, and infrastructure relationships become more complex. These changes may not always be reflected in documentation, but they are continuously reflected in telemetry.
Service communication patterns, workload behavior, infrastructure utilization, and operational events reveal how architecture changes over time.
This makes telemetry one of the most valuable sources of truth for understanding the actual state of cloud-native environments.
Organizations that analyze telemetry strategically gain visibility into architectural evolution that static documentation often cannot provide.
Cloud Costs Have a Telemetry Story Behind Them
Every cloud bill tells you what happened financially.
Telemetry helps explain why it happened operationally.
Rising infrastructure costs are often driven by workload behavior, scaling decisions, resource allocation policies, observability growth, AI infrastructure consumption, or architectural inefficiencies. These drivers rarely appear in financial reports alone.
However, they are often visible within operational telemetry.
Understanding cloud spending therefore requires connecting financial outcomes with infrastructure behavior. The telemetry narrative provides the missing link between resource consumption and operational decision-making.
Without this context, cost optimization becomes reactive. With it, optimization becomes proactive.
The Real Value of Telemetry is Understanding
Many organizations invest heavily in telemetry collection while underinvesting in telemetry interpretation.
Collecting data is relatively easy. Understanding what that data means is significantly harder.
The true value of telemetry is not the volume of information it provides but the operational understanding it enables.
When teams learn to connect metrics, logs, traces, events, workload behavior, infrastructure relationships, and operational trends, telemetry transforms from monitoring data into operational intelligence.
This shift enables better decisions, stronger governance, improved reliability, and more effective infrastructure management.
The future of operations depends less on gathering more telemetry and more on understanding the narrative already hidden within it.
Turn Telemetry into Operational Intelligence with Atler Pilot
As cloud-native environments become increasingly complex, organizations need more than telemetry collection and dashboard visibility. They need a deeper understanding of workload behavior, Kubernetes utilization, infrastructure dependencies, AI resource consumption, and the operational patterns shaping system performance.
Atler Pilot helps organizations uncover the operational narrative hidden within their infrastructure by connecting telemetry, workload intelligence, utilization insights, and governance visibility into a unified view of cloud-native environments. This enables teams to move beyond isolated metrics and gain a clearer understanding of how infrastructure behaves, evolves, and impacts business outcomes.
By transforming infrastructure signals into actionable intelligence, Atler Pilot helps engineering, platform, and FinOps teams identify inefficiencies, strengthen reliability, improve resource utilization, and make more informed operational decisions.
Telemetry tells you what happened. Operational intelligence helps you understand why. Sign up for Atler Pilot and discover how deeper infrastructure visibility can help your teams unlock the story hidden inside their telemetry.
Conclusion
Every cloud-native environment is constantly telling a story through its telemetry.
Metrics, logs, traces, events, and operational signals collectively reveal how workloads behave, how infrastructure evolves, where inefficiencies emerge, and how risks develop over time.
The challenge is that these stories are often hidden beneath overwhelming volumes of data. Teams focus on individual signals while missing the larger narrative connecting them.
Organizations that learn to interpret telemetry as an evolving operational story gain a powerful advantage. They can identify issues earlier, optimize infrastructure more effectively, improve reliability, and make better decisions based on a deeper understanding of how their environments actually operate.
Because the most valuable insight in modern operations is often not found in a single metric. It is found in the story that thousands of signals are telling together.
All in One Place
Atler Pilot decodes your cloud spend story by bringing monitoring, automation, and intelligent insights together for faster and better cloud operations.