
The Data Overload Problem
In the on-premises era, IT metrics were scarce. You measured server uptime and CPU utilization because that was the only data you had. In the modern cloud, the problem is inverted. An observability platform can easily generate 10,000 different time-series metrics per second from a single Kubernetes cluster.
When you have 10,000 metrics on a dashboard, you have zero actionable intelligence. Engineering teams suffer from metric fatigue, ignoring the dashboards completely until an outage forces them to hunt through the noise. To operate a complex cloud environment effectively, Cloud Operations (SRE and DevOps) teams must be ruthlessly selective about what they measure.
This guide defines the core Key Performance Indicators (KPIs) that actually matter for measuring engineering velocity, system reliability, and infrastructure efficiency in 2026.
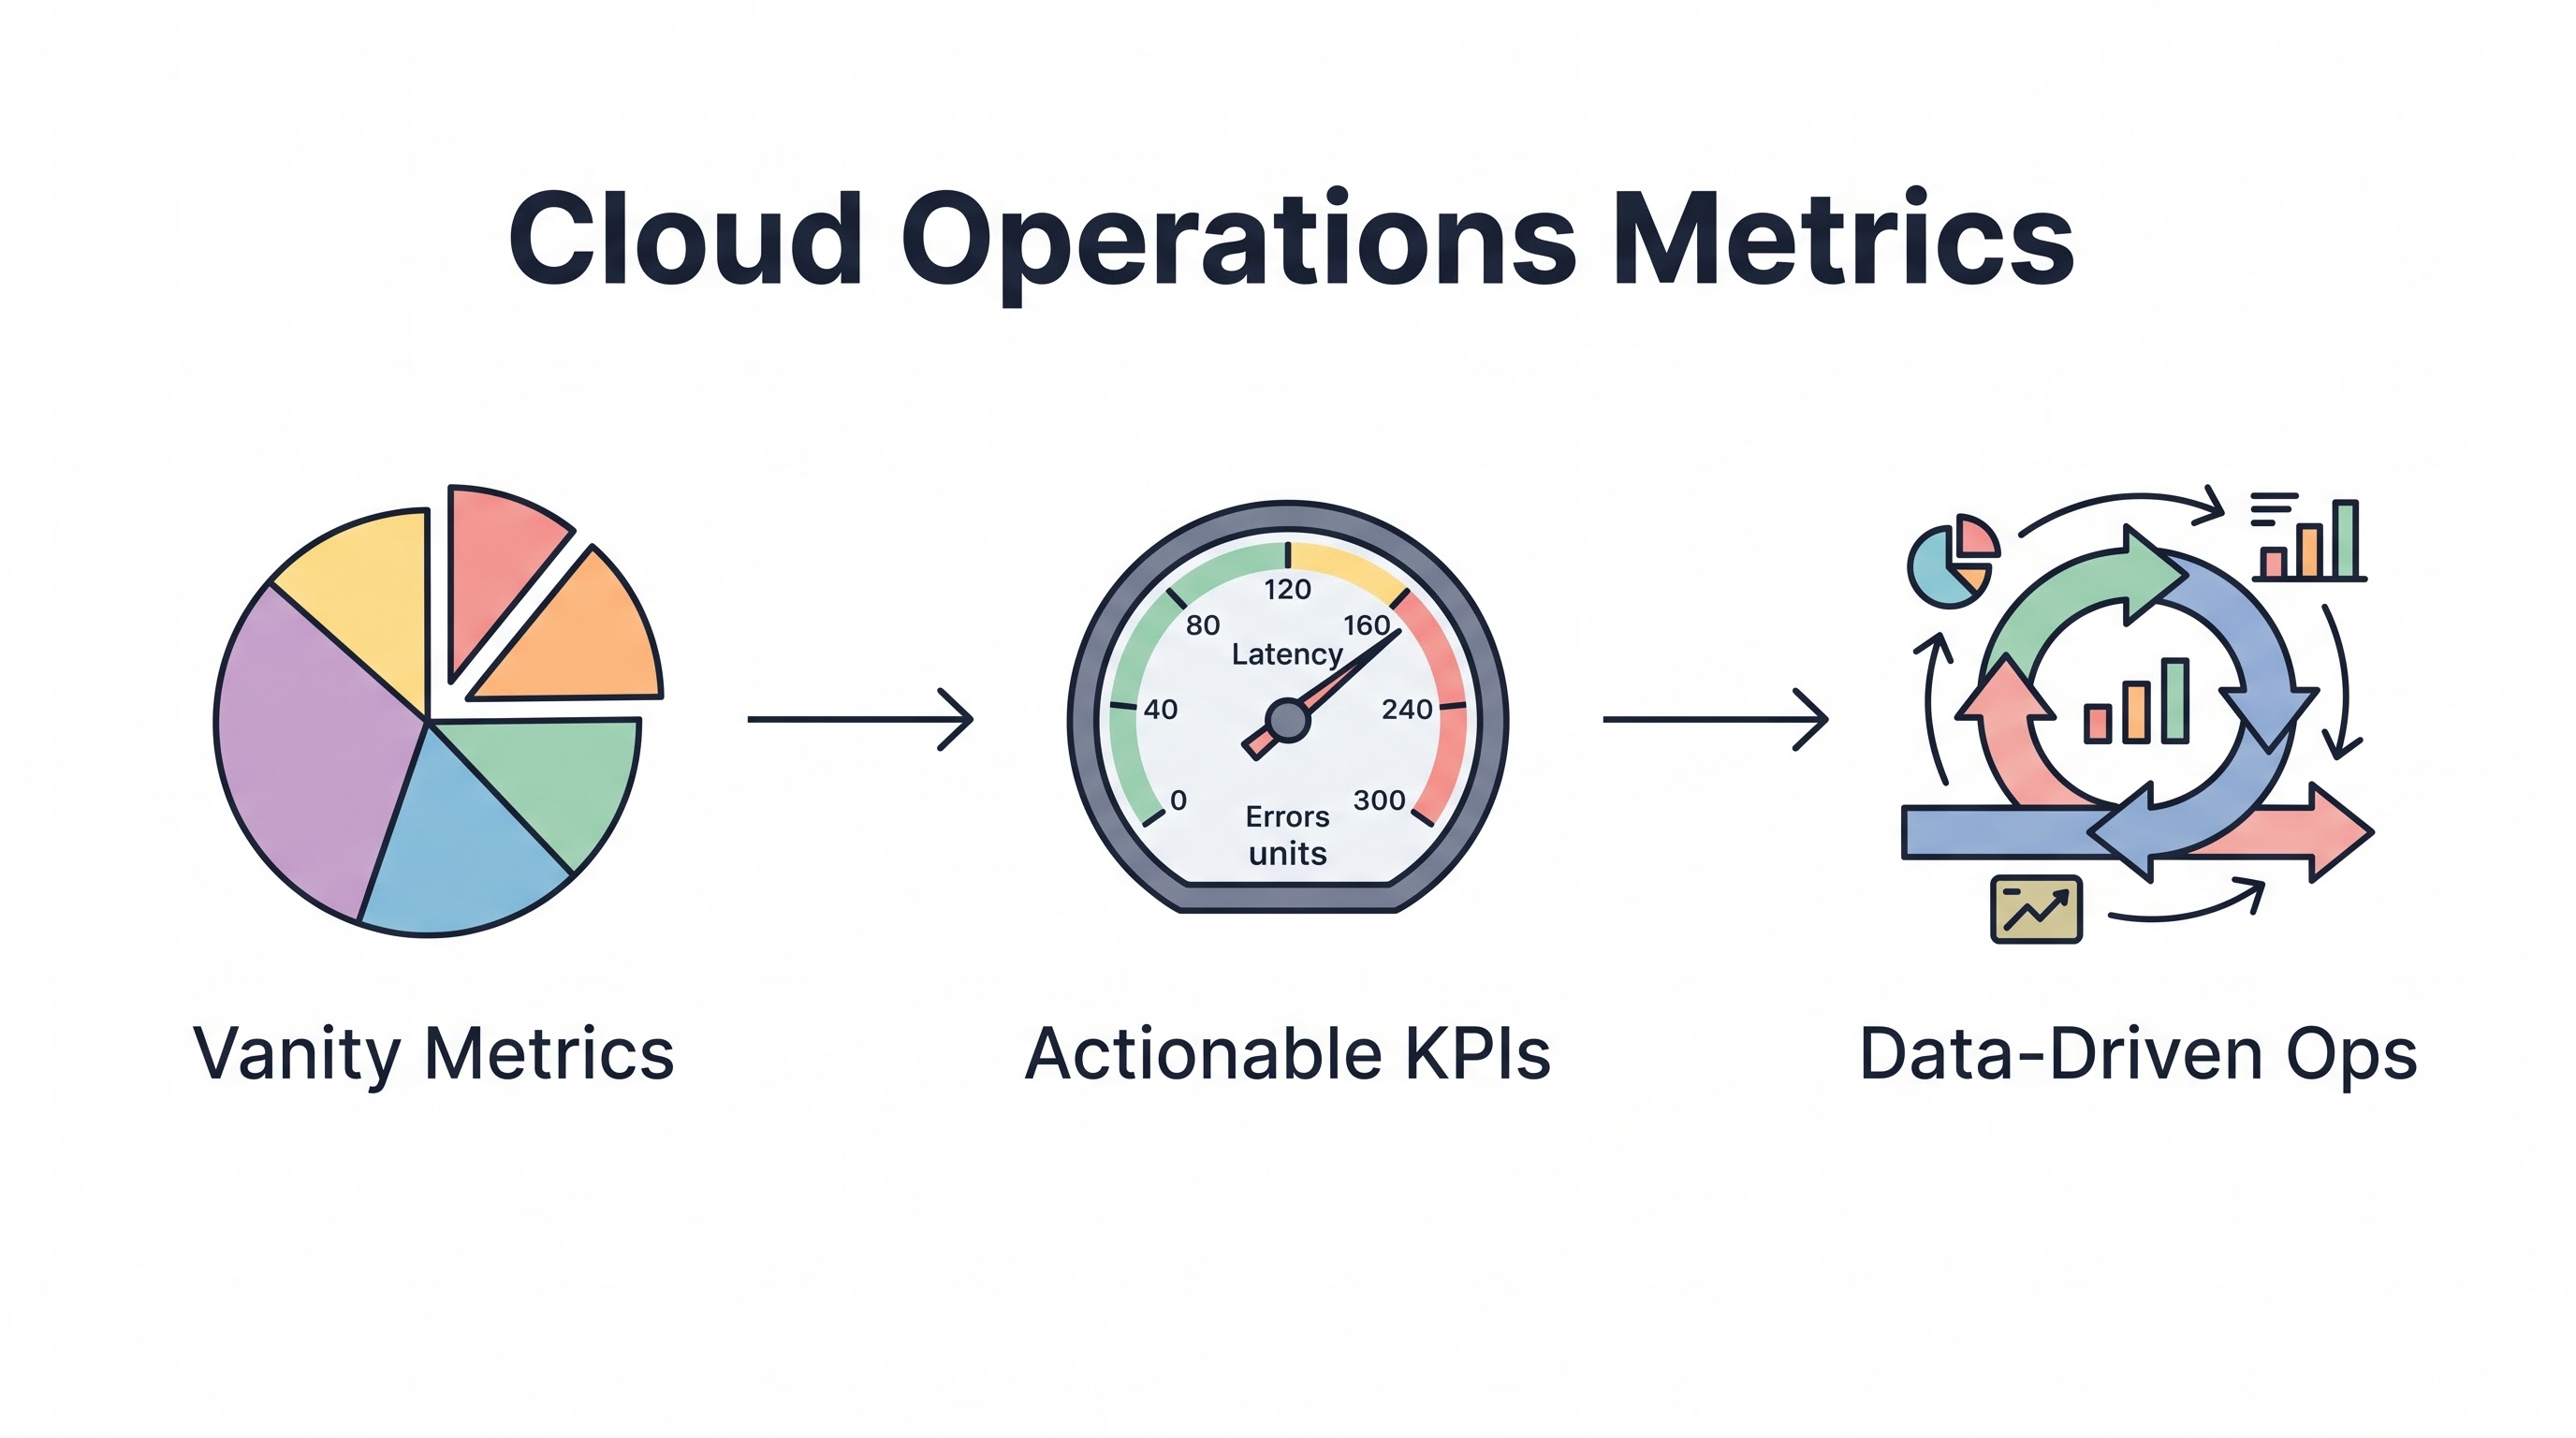
Vanity Metrics vs. Actionable Metrics
A metric is only valuable if a change in its value forces a change in human behavior.
Vanity Metric: "Total lines of code deployed this month." This number might go up, making management feel productive, but it provides no insight into the quality of the software or the reliability of the system. It drives no action.
Actionable Metric: "Mean Time to Recovery (MTTR) increased by 15% this week." This indicates a systemic failure in the incident response process. The required action is clear: investigate the recent incidents, find the bottleneck, and automate the manual steps.
Velocity and Stability: The DORA Metrics
Developed by the DevOps Research and Assessment (DORA) team (now part of Google Cloud), the four DORA metrics are the industry standard for measuring the performance of software delivery pipelines. They perfectly balance speed against stability.
Velocity Metrics
Deployment Frequency: How often is code deployed to production? Elite performers deploy on-demand (multiple times a day). A low frequency indicates overly complex, manual release processes.
Lead Time for Changes: How long does it take a commit to get into production? This measures the efficiency of the CI/CD pipeline and the automated testing suite.
Stability Metrics
Change Failure Rate: What percentage of deployments cause a failure in production (requiring a rollback or hotfix)? If deployment frequency is high, but the failure rate is 20%, the organization is prioritizing speed over quality dangerously.
Mean Time to Recovery (MTTR): How long does it take to restore service after a failure? As discussed in the Incident Management Guide, minimizing MTTR is the hallmark of a resilient organization.
Reliability: SLIs, SLOs, and Error Budgets
While DORA measures how code gets delivered, Site Reliability Engineering (SRE) measures how the application performs once it is running.
Service Level Indicator (SLI): A quantitative measure of some aspect of the service. (e.g., "The latency of the login API").
Service Level Objective (SLO): The target value for the SLI, agreed upon by business and engineering. (e.g., "99% of login API requests must complete in under 200ms over a rolling 30-day window"). Never target 100%. It is mathematically impossible and prohibitively expensive.
Error Budget: The allowable threshold for failure (100% minus the SLO). If the SLO is 99%, the error budget is 1%. This is the most critical metric. If a team burns through their error budget due to unstable releases, the consequences are immediate: feature development halts, and the team pivots 100% to reliability work until the budget recovers.
System Health: The Four Golden Signals
When building dashboards for monitoring specific microservices, SREs rely on Google's "Four Golden Signals." If you only measure four things, measure these:
Latency: The time it takes to service a request. (Crucially, track the 95th and 99th percentiles, not just the average, to identify outliers experiencing terrible performance).
Traffic: The total demand placed on the system (e.g., HTTP requests per second).
Errors: The rate of requests that fail (e.g., HTTP 500s). This must include explicit errors and implicit errors (a request that returned an HTTP 200 but contained a malformed payload).
Saturation: How "full" the service is. This measures utilization against known limits (e.g., database connection pool exhaustion, or CPU utilization hitting 90%). Saturation acts as an early warning system before latency spikes.
Efficiency: FinOps and Unit Economics
A fast, reliable system is a failure if it bankrupts the company. Operations metrics must include cost efficiency.
Cloud Unit Economics: As detailed in the FinOps Guide, this is the ultimate efficiency metric. Track the cloud cost required to process a single business unit (e.g., Cost per Checkout, Cost per API Call). If total cloud spend rises, but the Unit Cost falls, engineering is highly efficient.
Commitment Coverage: What percentage of the compute footprint is covered by Savings Plans or Reserved Instances? (Target: 70-85%).
Building a Metrics-Driven Culture
Gathering the data is the easy part. The hard part is organizational discipline. Metrics must be highly visible (public dashboards for DORA metrics across teams). More importantly, the metrics must have teeth. If an SLO is breached, the organization must actually possess the discipline to halt feature work, regardless of pressure from product managers. Without consequence, an SLO is just an aspiration.
Key Takeaway
Drown the noise. Focus operational measurement on three core pillars: Velocity/Stability (measured by DORA metrics), Reliability (measured by strict SLOs and Error Budgets), and Efficiency (measured by Cloud Unit Economics). Build observability dashboards that focus exclusively on the Four Golden Signals (Latency, Traffic, Errors, Saturation) to enable rapid triage during incidents, discarding vanity metrics that do not drive architectural action.
All in One Place
Atler Pilot decodes your cloud spend story by bringing monitoring, automation, and intelligent insights together for faster and better cloud operations.